
The following documentation is a part of the Graylog API Security product (formerly Resurface) technical documentation knowledge base. As we continue to improve our documentation offerings, please note that some articles or pieces of content may change. If you have any questions for the Graylog documentation team, please feel free to reach out to us via the community’s Documentation Campfire forum.
What is Graylog API Security?
Graylog API Security (formerly known as Resurface) captures real API traffic to detect real attacks, leaks, and other threats to your APIs. Our software discovers your APIs and the risks from their use by legit customers, malicious attackers, partners and insiders. With Graylog API Security, you'll be able to:
- Easily capture API calls at scale to your own first-party database.
- Immediately identify attacks and failures for REST and GraphQL APIs.
- Continuously scan API calls for quality and security risks.
- Threat hunt using any combination of request and response data elements.
- Retroactively search for identified zero-day threats and exploits.
- Create and share custom signatures without having to write any code.
- Integrate and automate using webhook alerts, SQL queries and data exports.
- Deploy in minutes to any local or cloud-based Kubernetes environment.
- Scale by adding Trino worker nodes or Iceberg storage (on S3 or Minio).
- Configure user SSO with OAuth, JWT, LDAP and Kerberos.
- Import and export API calls and signature definitions.
- Protect user privacy with logging rules and role-based controls.
Running on AWS
Resurface installs on any Kubernetes cluster with a single helm command, and uses optimized defaults when installing on Amazon EKS.
Then you can start capturing API calls to services running on Kubernetes, and other services running on AWS:
- Deploy a sniffer daemonset to automatically monitor APIs running inside your EKS clusters.
- Use VPC traffic mirroring to monitor APIs running on EC2, ECS or Fargate.
- Capture API calls fronted by AWS API Gateway using Kinesis integration.
- Use open-source logger libraries to capture API calls directly from your microservices.
Running on Azure
Resurface installs on any Kubernetes cluster with a single helm command, and uses optimized defaults when installing on Azure AKS.
Then you can start capturing API calls to services running on Kubernetes, and other services running on Azure:
- Deploy a sniffer daemonset to automatically monitor APIs running on your AKS clusters.
- Capture API calls fronted by Azure API Management (APIM) using Azure Event Hub integration.
- Use open-source logger libraries to capture API calls directly from your microservices.
Running on GCP
Resurface installs on any Kubernetes cluster with a single helm command, and uses optimized defaults when installing on Google GKE.
Then you can start capturing API calls to services running on Kubernetes, and other services running on GCP:
- Deploy a sniffer daemonset to automatically monitor APIs running on your GKE clusters.
- Use open-source logger libraries to capture API calls directly from your microservices.
Running on IBM Cloud
Resurface installs on any Kubernetes cluster with a single helm command, and uses optimized defaults when installing on IBM Cloud.
Then you can start capturing API calls to services running on Kubernetes, and other services running on IBM Cloud:
- Deploy a sniffer daemonset to automatically monitor APIs running on your Kubernetes clusters.
- Use open-source logger libraries to capture API calls directly from your microservices.
Running on Kubernetes
Resurface installs on any user-managed Kubernetes cluster (including microk8s), on 64-bit Intel and ARM chipsets.
Then you can start capturing API calls to services running on Kubernetes, and legacy systems on physical or virtualized infrastructure:
- Deploy a sniffer daemonset to automatically monitor APIs running on your Kubernetes clusters.
- Use open-source logger libraries to capture API calls directly from your microservices.
Installation
Getting Started
Installation
Using helm
Installing on AWS
Installing on Azure
Installing on GCP
Installing on IBM Cloud
Installing on microk8s
Installing on Kubernetes
Administration
Capturing API Calls
Adding Capacity
SQL Reference
JSON Format
Logging Rules
Troubleshooting
AWS Tutorials
✉️ Contact support
Resurface is Kubernetes-native software that is installed using helm. This section will provide all the installation commands to use for your target cloud platforms.
Using helm
Helm is the standard package manager for Kubernetes. Think apt or brew, but for your Kubernetes cluster.
After installing helm, you will be able to install and upgrade Kubernetes applications (called charts) onto your Kubernetes cluster. The main helm commands are shown below, and the rest of this documentation gives all the specific examples you'll need to administer your installation.
helm repo update      # fetch latest chart versions from all repositories
helm repo add <...>   # add a remote repository to use for installations
helm install <...>    # install a specific chart onto your Kubernetes cluster
helm upgrade <...>    # upgrade or reconfigure a specific chart
All of the examples below show installation into a dedicated namespace, so that these containers do not interfere with any others that are already deployed.
Installing on AWS
When installing Resurface on an existing EKS cluster, you'll need 6 vCPU and 18 GiB of memory for each Resurface node deployed. If these requirements cannot be met by your existing EKS cluster, create a new node group using m7g.2xlarge (ARM), m7i.2xlarge (x86), or larger VMs.
In addition, the Amazon EBS CSI Driver add-on must be enabled in your cluster in order to provision persistent volumes. The Amazon EBS CSI plugin requires IAM permissions to make calls to AWS APIs on your behalf, so be sure to create the corresponding IAM Role, or attach the AmazonEBSCSIDriverPolicy to your existing role.
Then install Resurface with helm, using optimized default options for AWS:
$ helm repo add resurfaceio https://resurfaceio.github.io/containers; helm repo update; helm install resurface resurfaceio/resurface --create-namespace --namespace resurface --set provider=awsFinally run this script to get your database URL, then paste into your browser to access your database:
$ echo http://$(kubectl get svc resurface-kubernetes-ingress --namespace resurface --template "{{ range (index .status.loadBalancer.ingress 0) }}{{.}}{{ end }}")/ui/Installing on Azure
When installing Resurface on an existing AKS cluster, you'll need 6 vCPU and 18 GiB of memory for each Resurface node deployed. If these requirements cannot be met by your existing AKS cluster, create a new node pool using Standard_D8ps_v5 (ARM), Standard_D8as_v5 (x86), or larger VMs.
Then install Resurface with helm, using optimized default options for Azure:
$ helm repo add resurfaceio https://resurfaceio.github.io/containers; helm repo update; helm install resurface resurfaceio/resurface --create-namespace --namespace resurface --set provider=azure --set kubernetes-ingress.controller.service.externalTrafficPolicy=LocalFinally run this script to get your database URL, then paste into your browser to access your database:
$ echo http://$(kubectl get svc resurface-kubernetes-ingress --namespace resurface --template "{{ range (index .status.loadBalancer.ingress 0) }}{{.}}{{ end }}")/ui/Installing on GCP
When installing Resurface on an existing GKE cluster, you'll need 6 vCPU and 18 GiB of memory for each Resurface node deployed. If these requirements cannot be met by your existing GKE cluster, create a new node pool using c3d-standard-8 (x86) or larger VMs. We do not recommend deploying on ARM at this time.
Then install Resurface with helm, using optimized default options for GCP:
$ helm repo add resurfaceio https://resurfaceio.github.io/containers; helm repo update; helm install resurface resurfaceio/resurface --create-namespace --namespace resurface --set provider=gcpFinally run this script to get your database URL, then paste into your browser to access your database:
$ echo http://$(kubectl get svc resurface-kubernetes-ingress --namespace resurface --template "{{ range (index .status.loadBalancer.ingress 0) }}{{.}}{{ end }}")/ui/Installing on IBM Cloud
When installing Resurface on Red Hat OpenShift on IBM Cloud, you'll need 6 vCPU and 18 GiB of memory for each Resurface node deployed. If these requirements cannot be met by your existing OpenShift cluster, create a node pool using bx2-8x32 (x86) or larger VMs. We do not recommend deploying on ARM at this time.
Create an OpenShift project:
$ oc new-project resurface --description="Resurface discovers and alerts on quality and security signatures in your API traffic" --display-name="Resurface"Then install Resurface with helm, using optimized default options:
$ helm install resurface resurfaceio/resurface --set provider=ibm-openshift --set ingress.controller.enabled=false --set ingress.tls.host=$(oc -n openshift-ingress-operator get ingresscontrollers.operator.openshift.io default -o jsonpath='{.status.domain}') --namespace resurfaceAdd the `anyuid` scc to the resurface service account:
$ oc adm policy add-scc-to-user anyuid -z resurface-saFinally run this script to get your database URL, then paste into your browser to access your database:
$ echo http://$(oc get route --namespace resurface --template "{{ (index .items 0).spec.host }}")/ui/Installing on microk8s
Microk8s is a lightweight Kubernetes distribution, which runs on your own hardware. To start, you'll need a Linux machine or VM with at least 8 vCPU and 24GB of memory. Each Resurface node requires 6 vCPU and 18 GB of memory, and there needs to be resources left over for microk8s, Minio (if enabled), and the operating system.
Microk8s requires snap, which is enabled by default on Ubuntu and its derivatives. For other Linux distributions, enable snap support before installing microk8s.
# install microk8s
sudo snap install microk8s --classic;
sudo usermod -a -G microk8s $USER;
newgrp microk8s;
alias helm='microk8s helm';
alias kubectl='microk8s kubectl';

# disable microk8s daemon-apiserver-kicker
echo "--bind-address 0.0.0.0" >> /var/snap/microk8s/current/args/kube-apiserver;
microk8s stop; microk8s start;

# configure microk8s
microk8s enable dns;
microk8s enable hostpath-storage;
microk8s status --wait-ready;

# bind machine IP address to microk8s
microk8s enable metallb:X.X.X.X-X.X.X.X;

# install Resurface
helm repo add resurfaceio https://resurfaceio.github.io/containers;
helm repo update;
helm install resurface resurfaceio/resurface --create-namespace --namespace resurface;
Run this script to get your database URL, then paste into your browser to access your database:
$ echo http://$(kubectl get svc resurface-kubernetes-ingress --namespace resurface --template "{{ range (index .status.loadBalancer.ingress 0) }}{{.}}{{ end }}")/ui/Installing on Kubernetes
For AKS, EKS, GKE, OpenShift, and microk8s, it's recommended to use the instructions provided above. When installing Resurface on other types of Kubernetes clusters, including the single-node Kubernetes cluster bundled with Docker Desktop, you'll need 6 vCPU and 18 GiB of memory for each Resurface node deployed.
Install Resurface with helm, using generic default options:
$ helm repo add resurfaceio https://resurfaceio.github.io/containers; helm repo update; helm install resurface resurfaceio/resurface --create-namespace --namespace resurfaceRun this script to get your database URL, then paste into your browser to access your database:
$ echo http://$(kubectl get svc resurface-kubernetes-ingress --namespace resurface --template "{{ range (index .status.loadBalancer.ingress 0) }}{{.}}{{ end }}")/ui/Administration
This section covers all the helm and kubectl commands you'll need to administer your Resurface clusters, whether you are a helm guru already or using Kubernetes for the first time.
Configuring DNS
In order to enable TLS or authentication, you'll first need to assign a DNS name to your Resurface installation. We'll use the name MYRESURFACE in the examples here.
The MYRESURFACE name needs to resolve to the EXTERNAL-IP associated with your Resurface installation, as reported by this script:
$ kubectl get svc resurface-kubernetes-ingress -n resurfaceOnce you have created your DNS entry, you should be able to access your Resurface installation using this url:
Enabling TLS
Resurface bundles an ingress controller that is intended to be used for TLS termination. We strongly recommend configuring TLS so that data is encrypted over the network.
You can easily generate a TLS certificate-key pair for your Resurface installation, or you can use your own certificate if you have one already.
⚠️ DNS resolution must be configured before TLS can be enabled.
Cert-manager configurations
If you don't have a TLS certificate-key pair yet, Resurface makes it super easy to generate one. Resurface includes the cert-manager utility to automatically issue (and renew) a TLS certificate for your Resurface installation, using Let's Encrypt as your certificate authority.
First install cert-manager into your Resurface namespace:
$ helm repo add jetstack https://charts.jetstack.io; helm repo update; helm install cert-manager jetstack/cert-manager --namespace resurface --version v1.13.3 --set installCRDs=true --set prometheus.enabled=falseNow enable TLS for your Resurface installation, using cert-manager to manage your certificate:
$ helm upgrade -i resurface resurfaceio/resurface --namespace resurface --set ingress.tls.enabled=true --set ingress.tls.host=MYRESURFACE --set ingress.tls.autoissue.enabled=true --set ingress.tls.autoissue.staging=false --set ingress.tls.autoissue.email=MYEMAIL --reuse-valuesBring-your-own-certificate configurations
If you already have a TLS certificate-key pair, you can create a Kubernetes secret to store them like this:
$ kubectl create secret tls resurface-tls-secret -n resurface --cert=PATH/TO/CERT/FILE --key=PATH/TO/KEY/FILENow enable TLS for your Resurface installation, referencing the Kubernetes secret:
$ helm upgrade -i resurface resurfaceio/resurface --namespace resurface --set ingress.tls.enabled=true --set ingress.tls.host=MYRESURFACE --set ingress.tls.byoc.secretname=resurface-tls-secret --reuse-valuesEnabling authentication
⚠️ DNS resolution and TLS has to be configured before authentication can be enabled.
Basic authentication
Use the following command to enable basic authentication for a single user. (On some systems, you may have to add noglob to the start of the shell command)
$ helm upgrade -i resurface resurfaceio/resurface -n resurface --set auth.enabled=true --set auth.basic.enabled=true --set auth.basic.credentials[0].username=rob --set auth.basic.credentials[0].password=blah1234 --reuse-valuesTo enable basic authentication for multiple users, it's easier to create an auth.yaml file than to specify user names and passwords at the command line. Here's an example auth.yaml file that defines three users:
auth:
  enabled: true
  basic:
    enabled: true
    credentials:
      - username: rob
        password: blah1234
      - username: jsmith
        password: hunter2
      - username: admin
password: irtRUqUp7fkfLReload the auth.yaml file whenever user names or passwords are changed:
$ helm upgrade -i resurface resurfaceio/resurface -n resurface -f auth.yaml --reuse-values⚠️ At this time, Resurface does not support password resets from the log in page. The only way to change user passwords is through helm.
OAuth authentication
auth:
  enabled: true
  oauth2:
    enabled: true
    issuer: https://accounts.google.com
    authurl: https://accounts.google.com/o/oauth2/v2/auth
    tokenurl: https://oauth2.googleapis.com/token
    jwksurl: https://www.googleapis.com/oauth2/v3/certs
    userinfourl: https://openidconnect.googleapis.com/v1/userinfo
    clientid: sampleid123.apps.googleusercontent.com
clientsecret: samplesecret456Reload the auth.yaml file whenever OAuth configuration is changed:
$ helm upgrade -i resurface resurfaceio/resurface -n resurface -f auth.yaml --reuse-valuesJWT authentication
auth:
  enabled: true
  jwt:
    enabled: true
jwksurl: << your JWKS URL>>Reload the auth.yaml file whenever JWT configuration is changed:
$ helm upgrade -i resurface resurfaceio/resurface -n resurface -f auth.yaml --reuse-valuesUsing multiple authentication methods
auth:
  enabled: true
  basic:
    enabled: true
    credentials:
      - username: rob
        password: blah1234
      - username: jsmith
        password: hunter2
      - username: admin
        password: irtRUqUp7fkfL
  oauth2:
    enabled: true
    issuer: https://accounts.google.com
    authurl: https://accounts.google.com/o/oauth2/v2/auth
    tokenurl: https://oauth2.googleapis.com/token
    jwksurl: https://www.googleapis.com/oauth2/v3/certs
    userinfourl: https://openidconnect.googleapis.com/v1/userinfo
    clientid: sampleid123.apps.googleusercontent.com
clientsecret: samplesecret456$ helm upgrade -i resurface resurfaceio/resurface -n resurface -f auth.yaml --reuse-valuesSetting timezone
Containers run with UTC timezone by default, but it's easy to set all containers to a specific timezone:
$ helm upgrade -i resurface resurfaceio/resurface -n resurface --set custom.config.tz="America/Denver" --reuse-valuesUpgrading to latest version
It's easy to upgrade a Resurface cluster to the latest release version. This makes sure that you have all the latest features, fixes and security patches. All data stored in your Resurface database will be available after the upgrade without any manual intervention.
$ helm repo update; helm upgrade -i resurface resurfaceio/resurface -n resurface --reuse-valuesUninstalling Resurface
Removing Resurface from your Kubernetes cluster is easy, and won't impact any other applications deployed using Helm. Removing the Resurface namespace with kubectl also removes all persistent volumes. Please note there is no way to reverse this once done.
$ helm uninstall resurface -n resurface; kubectl delete namespace resurfaceCapturing API Calls
Getting Started
Installation
Administration
Capturing API Calls
Getting capture URL
Submitting JSON
Sniffer DaemonSet
Sniffer sidecar
VPC traffic mirroring
Tyk API Gateway
AWS API Gateway
Azure API Management
Kong API Gateway
Logger libraries
Adding Capacity
SQL Reference
JSON Format
Logging Rules
Troubleshooting
AWS Tutorials
✉️ Contact support
Resurface captures API calls from network sniffers, API gateways, and API microservices, in any combination. This section covers all the options to capture API calls to your Resurface database.
Getting capture URL
Each Resurface cluster has a capture URL that is used to receive incoming API calls. This is different than the URL used to connect to the database. Run this script to get your capture URL:
$ echo http://$(kubectl get svc resurface-kubernetes-ingress --namespace resurface --template "{{ range (index .status.loadBalancer.ingress 0) }}{{.}}{{ end }}")/fluke/messageSubmitting JSON
Resurface accepts API calls in JSON format from practically any source, including curl. This makes for an easy "hello world" test to verify that your database is able to receive API calls over the network, before configuring any sniffers or other data sources.
Here's an example of using `curl` to capture a single API call:
$ curl -X POST -H "Content-type: application/json" --data '[["request_method","GET"],["request_url", "http://myurl"],["response_code","200"]]' Sniffer DaemonSet
Resurface can deploy a network sniffer to every node in your Kubernetes cluster using a DaemonSet. This allows API calls to be captured without having to modify each pod. Our sniffer discovery feature automatically captures all API traffic as services start and stop within the cluster.
The sniffer DaemonSet is disabled by default, but can be enabled with a simple helm command:
$ helm upgrade -i resurface resurfaceio/resurface --namespace resurface --set sniffer.enabled=true --set sniffer.discovery.enabled=true --reuse-valuesSniffer sidecar
Resurface provides a containerized network-level packet-capture sniffer that can run alongside your own applications as a sidecar. This allows API calls to be captured directly from their shared network interface. Our sniffer sidecar works for AWS ECS, Azure ACI, Docker compose, stand-alone Kubernetes manifests and pretty much anywhere where you can run multi-container applications.
VPC traffic mirroring
Traffic mirroring (supported by Amazon VPC) copies network traffic from EC2 instances to monitoring platforms like Resurface. This allows a high volume of API traffic to be delivered to a Resurface network sniffer that captures the API calls. Traffic monitoring doesn't require changes to any existing APIs, and doesn't negatively impact API performance.
Tyk API Gateway
For APIs fronted by a Tyk gateway, API calls can be easily captured to Resurface through the Tyk pump. Using the Tyk pump does not slow down calls made through the Tyk gateway. All code related to Tyk pump integration is open-source (and packaged/distributed by Tyk), but is independently tested and supported by Resurface.
We're proud to be part of the Tyk community! Resurface Labs won a Tyk Community Award in 2021, and announced a formal partnership with Tyk in 2023.
AWS API Gateway
For APIs fronted by Amazon API Gateway, API calls can be captured to your Resurface database through Kinesis data streams. This doesn't require changes to any existing APIs, and doesn't negatively impact API performance. This open-source integration module is shared on GitHub under the Apache2 license, and is fully supported by Resurface.
Azure API Management
For APIs fronted by Azure API Management (APIM), API calls can be captured to your Resurface database through Event Hub integration. This doesn't require any changes to your existing APIs, just minor changes to your APIM configuration. This open-source integration module is shared on GitHub under the Apache2 license, and is fully supported by Resurface.
Kong API Gateway
For APIs fronted by a Kong gateway, API calls can be captured to Resurface just by adding a Kong plugin. Our open-source plugin is hosted on GitHub, shared under the Apache2 license, and is fully supported by Resurface.
Logger libraries
Our open-source logging libraries are easy to integrate, with friendly Apache2 licensing and minimal dependencies. Plus these include prebuilt middleware for many popular frameworks, so you can be logging API calls in just a few minutes.
Adding Capacity
Resurface scales from relatively small to really big, using the same helm commands. Start with a single node, or a small cluster, before turning on Iceberg integration and scaling to many terabytes of storage.
Capacity planning
Simply put, Resurface scales by adding nodes to a cluster. However Resurface is deployed or configured, you'll see an immediate linear improvement in capture and storage capacity with each node added.
Kinds of nodes: When first installed, a Resurface cluster contains a single node, called the coordinator node. The cluster can be expanded by adding one or more worker nodes. All nodes participate in capturing API calls and processing distributed queries. Only the coordinator node runs the Resurface UI and responds to SQL queries from external applications.
Sizes of nodes: Coordinator and worker nodes within a cluster are always the same size. CPU and memory quotas are enforced through Kubernetes. Larger quotas are typically enforced when Iceberg integration is enabled.
Capture capacity: Each node in a cluster can typically capture between 1k-10k calls/sec, depending on the size of your API calls and the speed of your virtual CPUs.
Storage capacity: Each node in a cluster has a local persistent volume that can typically store 1-10M calls, depending on the size and compressability of your API calls. When Iceberg integration is enabled, Resurface uses up to 100GB of S3/Minio storage per node deployed.
External services: Resurface does not depend on any Hadoop, Hive, RDS, Kafka, Spark, Zookeeper services or external databases. Resurface optionally requires S3 or Minio for storage when Iceberg integration is enabled. Resurface optionally integrates with existing authentication services as needed.
Supported chipsets: Resurface runs on 64-bit x86 and ARM CPUs, including Intel Xeon, AMD, Amazon Graviton and Apple Silicon. It is recommended (but not strictly required) that all nodes in a cluster use the same chipset.
Fault tolerance
Trino (and therefore Resurface) uses an eventual availability approach to fault tolerance. Resurface is designed to avoid permanently losing data when a single node fails, but some data or functionality may be temporarily unavailable when one or more nodes are down. This approach works well when the failure/partitioning of a node is relatively rare, when the recovery of a node is relatively fast, and when there is no appetite to deploy all the extra/duplicate infrastructure required to guarantee high availability. Trino does not currently support true HA deployments because the eventual availability model works so well, especially on Kubernetes where failed nodes will be automatically recovered.
Coordinator availability: If the coordinator node goes down, the Resurface UI will not be available, and the cluster will be unable to process any external queries until the coordinator node is recovered. Under normal circumstances, Kubernetes will restore a failed coordinator within a few minutes. Alerting and other integration features are only available while the coordinator node is running. Worker nodes will be able to capture API calls without interruption while the coordinator node is down or restarting.
Worker availability: If a worker node fails, all remaining nodes will continue to capture API calls without interruption. Data stored locally by the failed worker will be unavailable until the worker node is restarted, which is typically within a few minutes.
Iceberg availability: Any data stored on Iceberg is available as long as the coordinator node in a cluster is running, and S3/Minio are operating and reachable over the network. (Minio provides rich options for storage availability, which are managed separately from Resurface)
For individual queries: An individual query will fail if any node fails while the query is being executed. Trino has recently introduced new options for fault-tolerant execution of queries, but these aren't supported by Resurface yet.
Out-of-space handling: Resurface is designed to operate while retaining as much data as possible. The database will automatically drop the oldest API calls as new ones arrive. Resurface operates at >80% of its configured capacity without requiring any manual intervention. If an unexpected out-of-space condition is detected (typically due to a misconfiguration) then Resurface will reduce its storage settings accordingly and attempt to keep running.
Configuring workers
Within a few minutes of being created, new workers will automatically connect to the coordinator node and start capturing API calls.
Scale your Resurface database to a 3-node cluster:
$ helm upgrade -i resurface resurfaceio/resurface -n resurface --set multinode.enabled=true --set multinode.workers=2 --reuse-values⚠️ You can reduce the number of workers, but data stored by those workers will be lost when their persistent volumes are deleted.
Enabling Iceberg storage
Apache Iceberg is a popular open standard for storing huge tables, and is natively supported by Resurface and Trino.
Resurface is the only API security platform that offers seamless Iceberg integration. To the user or integrator, Resurface behaves exactly the same when Iceberg storage is enabled, but there will be a lot more data available for analysis.
Iceberg requires an external object store, which can be either Minio or Amazon S3. API calls are initially captured on Resurface nodes, and then this data is moved to Minio or S3 in the background automatically, without users being aware this is happening. Resurface manages this entire process by creating Iceberg tables and views, periodically migrating new data to Iceberg, deleting old data from Minio/S3 as new data arrives, and ensuring that queries never encounter duplicate or missing details as replication occurs. Any data that is already stored on the Resurface cluster will be preserved when Iceberg integration is enabled. All default and custom signatures (and all external SQL queries) will continue to work without any changes.
⚠️ Iceberg storage is enabled through a special license option. Please contact us if you'd like an evaluation license.
⚠️ Once enabled, Iceberg storage cannot be disabled without losing all data stored by the cluster.
Enable Iceberg integration for Minio:
$ helm upgrade resurface resurfaceio/resurface -n resurface --reuse-values --set iceberg.enabled=true --set minio.enabled=true --set minio.rootUser=YOUR_CUSTOM_MINIO_USERNAME --set minio.rootPassword=YOUR_CUSTOM_MINIO_PASSWORDOptionally enable Minio console:
$ helm upgrade resurface resurfaceio/resurface -n resurface --set ingress.minio.expose=true --reuse-valuesEnable Iceberg integration for S3, when running on AWS:
$ helm upgrade resurface resurfaceio/resurface -n resurface --reuse-values --set iceberg.enabled=true --set iceberg.s3.enabled=true --set iceberg.s3.bucketname=YOUR_AWS_S3_BUCKET_NAME --set iceberg.s3.aws.region=YOUR_AWS_S3_BUCKET_REGION --set iceberg.s3.aws.accesskey=YOUR_AWS_ACCESS_KEY_ID --set iceberg.s3.aws.secretkey=YOUR_AWS_SECRET_ACCESS_KEYSQL Reference
Getting Started
Installation
Administration
Capturing API Calls
Adding Capacity
SQL Reference
About Trino
Client connections
Generating SQL
Schemas and views
Column definitions
Bitmap columns
Bitmap collections
Custom views
Connector functions
JSON Format
Logging Rules
Troubleshooting
AWS Tutorials
✉️ Contact support
Resurface is powered by a distributed SQL database, with an opinionated schema that is purpose-built for API monitoring. This section will help you run any kind of SQL query, from simple counts to complex aggregations.
About Trino
Resurface is built on Trino, formerly known as PrestoSQL. This was originally developed at Facebook but is now an independent open-source project. Trino is a powerful distributed query engine that provides a common SQL interface to many popular databases, and has a small footprint compared with many big data platforms.
Resurface extends and optimizes Trino in a few key ways:
- The Resurface web interface runs alongside the Trino web UI.
- Resurface uses native Iceberg support provided by Trino.
- Resurface adds a hot-data storage engine for short-term capture and querying of API calls.
- Resurface seamlessly replicates data to Iceberg while providing uninterrupted query access to all API calls.
- Resurface adds custom scalar and aggregate functions to optimize queries on API calls.
- Resurface inherits all Trino security features for TLS, user authentication, and user permissions.
We're happy to support and contribute back to the Trino community! 🐰
Rob hangs with the Trino team to dish about custom storage engines and API use-cases.
Client connections
There are several ways to connect to Resurface and run SQL queries, depending on your requirements.
Each connection method supports the same SQL dialect, and the same TLS and user authentication options to protect your data.
Using JSON API
This is the easiest way to submit external queries but has some key limitations.
Benefits:
- REST interface requiring no client libraries
- Accepts a single SQL statement (from POST data)
- Supports complex statements including
WITHandUNION ALL - Supports multiple statements (encoded as array)
- Returns query results as JSON document
Limitations:
- Only string and number types supported
- Not suitable for huge result sets
- Simple error handling (empty document on failure)
Query when no authentication is configured:
curl -X POST --user 'rob:' --data 'select count(*) as total from resurface.data.messages' http://localhost/ui/api/resurface/runsqlQuery with basic authentication:
curl -X POST --user 'rob:blah1234' --data 'select count(*) as total from resurface.data.messages' https://localhost/ui/api/resurface/runsqlIn the previous two examples, curl converts the user parameter into a valid Authorization header. If you aren't using curl, you'll have to calculate
the Authorization header by appending username:password and applying base64 encoding.
Query with Authorization header:
curl -X POST -H "Authorization: cm9iOmJsYWgxMjM0" --data 'select count(*) as total from resurface.data.messages' https://localhost/ui/api/resurface/runsqlUsing Trino client libraries
This is the most flexible way to submit external queries but requires more work to integrate.
Benefits:
- All client libraries are free and open-source
- Exposes native types for numbers, dates, arrays, and maps
- Easier iterating through very large datasets
- Custom error handling supported
Limitations:
- Requires Trino JDBC, ODBC, Java, Python, Node, or R library
- No automatic conversion to JSON
- More difficult to integrate
Trino documentation provides a simple JDBC example to follow.
Start with a count query:
select count(*) as total from resurface.data.messagesUsing common database tools
Trino works with DBeaver, dbt, DataGrip, Metabase, Tableau, Looker, Superset, and many other database & ETL tools. Some of these tools are preconfigured with Trino client libraries, but it's recommended to use the library version that matches the bundled Trino version.
Start with a count query:
select count(*) as total from resurface.data.messagesGenerating SQL
Now that you can connect and execute a basic count query, the obvious question is how to build SQL statements for more interesting cases.
While there are lots of examples shown in this documentation, Resurface makes it easy to copy SQL statements for any data shown the web interface. This is
typically easier than writing SQL by hand, especially since any relevant WHERE and GROUP BY clauses will be generated for you.
You'll find this Copy SQL function in the Share menu, and in the Copy button displayed in most charts. You can then paste this SQL into your client
or editor of choice.
Schemas and views
All of the data managed by Resurface is available through SQL queries, including request/response data, signature definitions, summary views, and settings. The database is organized into different schemas, where each schema acts as a separate namespace.
Examples in this documentation use fully qualified names: resurface.<schema-name>.<view-name>
All fully qualified names start with resurface because this refers to the Resurface connector for Trino. This connector manages all Resurface
schemas and their views, including views that merge data across Resurface and Iceberg connectors.
System views
The resurface.system schema is used for summaries that are automatically updated as new data arrives. With its fast cache for per-day and
per-signature summaries, resurface.system is the best starting point for multi-day reporting.
The resurface.system.summary view provides a multi-dimensional summary for each calendar day.
The resurface.volatile.sparklines view provides a sparkline summary for each configured signature.
Settings views
Configuration settings are stored in the resurface.settings schema.
Settings should only be modified using the web interface, but can be read by SQL queries.
Get all signature definitions:
select * from resurface.settings.view_catalog order by table_nameGet definition for a single signature:
select * from resurface.settings.view_catalog where table_name = 'completed_attacks'Data views
The single most important view is resurface.data.messages, which returns all API calls and has predefined columns for all request and response details.
This view merges data across Resurface and Iceberg catalogs, so that clients have a single unified view across all available data, even while data
is being replicated. This is also the base view for all signature views.
Get count of all API calls captured so far:
select count(*) from resurface.data.messagesGet all request and response details with limit:
select * from resurface.data.messages limit 100Get all details with offset & limit:
select * from resurface.data.messages offset 50 limit 100Select statements can use WHERE, HAVING, ORDER BY and WITH clauses as supported by Trino.
Get count of all GET requests:
select count(*) from resurface.data.messages where request_method = 'GET'Group by request method:
select request_method, count(*) from resurface.data.messages group by request_methodGroup by request method, using histogram function:
select histogram(request_method) from resurface.data.messagesSignature views
Each signature is available as a SQL view in the resurface.runtime schema.
Get count of completed attacks:
select count(*) from resurface.runtime.completed_attacksSignature views have the same predefined columns as resurface.data.messages for all request and response details.
Get all details for first 50 completed attacks:
select * from resurface.runtime.completed_attacks limit 50Get details for first 50 completed attacks with 'GET' request method:
select * from resurface.runtime.completed_attacks where request_method = 'GET' limit 50Index views
The resurface.data.messages_index view is significantly faster than resurface.data.messages for most types of queries.
But resurface.data.messages_index does not include a few specific (and typically large) columns:
graphql_queryrequest_bodyrequest_headersresponse_bodyresponse_headers
If your query doesn't touch any of the columns above, it's usually much faster to use the indexed variation.
Get count of all rows, with index:
select count(*) from resurface.data.messages_indexGet count of all GET requests, with index:
select count(*) from resurface.data.messages_index where request_method = 'GET'Indexes are supported for signatures as well, with one important limitation. An index will be created in the resurface.runtime_indexes schema only if the
signature does not reference any very large columns.
Get count of attacks, with index:
select count(*) from resurface.runtime_indexes.completed_attacks⚠️ Resurface does not automatically rewrite queries from external clients to use indexes when available. The only way to use an index is to explicitly
reference the resurface.data.messages_index view or the resurface.runtime_indexes schema as shown in the examples above.
Column definitions
These columns for request and response details are common across resurface.data.messages, signature views, and their indexes.
request_address
request_body
request_content_type
request_headers
request_json_type
request_method
request_method_safe
request_params
request_path
request_path_safe
request_port
request_protocol
request_query
request_url
request_user_agent
size_host_bytes
size_request_bytes
size_request_body_bytes
size_request_headers_bytes
size_request_params_bytes
size_request_url_bytes
response_body
response_code
response_code_int
response_content_type
response_date
response_date_and_hour
response_date_and_min
response_day_of_month
response_day_of_week
response_headers
response_hour_of_day
response_json_type
response_status
response_time
response_time_millis
size_response_bytes
size_response_body_bytes
size_response_headers_bytes
size_total_bytes
agent_category
The general category of agent used to make the API request. Calculated from request_user_agent, which may be spoofed by attackers.
Type: varchar
Indexed: yes
Example values:
Browser, Robot, Mobile App, Hacker, Cloud, UnknownSearch by value:
select count(*)
from resurface.data.messages_index
where agent_category = 'Robot'
Summarize by value:
select agent_category, count(*) as count
from resurface.data.messages_index
group by agent_category order by count desc
agent_device
The type of hardware used to make the API request. Calculated from request_user_agent, which may be spoofed by attackers.
Type: varchar
Indexed: yes
Example values:
Desktop, Robot, Unknown, Robot Mobile, Phone, Hacker, Table, Mobile, Watch, TVSearch by value:
select count(*)
from resurface.data.messages_index
where agent_device = 'Robot'
Summarize by value:
select agent_device, count(*) as count
from resurface.data.messages_index
group by agent_device order by count desc
agent_name
The name of the software program used to make the API request. Calculated from request_user_agent, which may be spoofed by attackers.
Type: varchar
Indexed: yes
Example values:
Chrome, AWS Security Scanner, Firefox, Zgrab, Safari, Googlebot, Masscan, BingbotSearch by value:
select count(*)
from resurface.data.messages_index
where agent_name = 'Chrome'
Summarize by top 100 values:
select agent_name, count(*) as count
from resurface.data.messages_index
group by agent_name order by count desc limit 100
apikey
Type: varchar
Indexed: yes
cookies
Type: varchar
Indexed: yes
cookies_count
Type: varchar
Indexed: yes
custom_fields
Special fields provided by loggers to capture additional details about the API call, user, or environment. These fields are not part of the original request or response, and cannot be filtered with logging rules.
Type: varchar
Indexed: yes
domain
Summarizes host into supported and unsupported DNS names, to aid with API discovery and drift detection. Detection of monitored, deprecated, and
prohibited domains is controlled through user settings. DNS names are flattened to a maximum of three segments (a.b.c) for better grouping.
Type: varchar
Indexed: yes
Example values:
api.resurface.io       monitored domain
(Rogue)                uncategorized calls
(Prohibited)           unsupported or out-of-policy calls
(Deprecated)           calls to legacy APIs
(IP address)           no DNS name present
(Missing)              no host present
(Malformed)            host is present but not parseable
Search by value:
select count(*)
from resurface.data.messages_index
where domain = '(Rogue)'
Summarize by top 100 values:
select domain, count(*) as count
from resurface.data.messages_index
group by domain order by count desc limit 100
graphql_operation_name
The name of the operation actually invoked for a single GraphQL operation. A GraphQL query can declare multiple operation names but only one of these
is invoked per call. Only present when graphql_operations_count is equal to one, and null in other cases.
Type: varchar
Indexed: yes
Example value:
HeroNameAndFriendsSearch by value:
select count(*)
from resurface.data.messages_index
where graphql_operation_name = 'IntrospectionQuery'
Summarize by top 100 values:
select graphql_operation_name, count(*) as count
from resurface.data.messages_index
group by graphql_operation_name order by count desc limit 100
graphql_operation_type
The type of the operation actually invoked for a single GraphQL operation. A GraphQL query can declare multiple operations but only one of these is
invoked per call. Only present when graphql_operations_count is equal to one, and null in other cases.
Type: varchar
Indexed: yes
Allowed values:
QUERY, MUTATION, SUBSCRIPTIONSearch by value:
select count(*)
from resurface.data.messages_index
where graphql_operation_type = 'MUTATION'
Summarize by value:
select graphql_operation_type, count(*) as count
from resurface.data.messages_index
group by graphql_operation_type order by count desc
graphql_operations
Parsed details about any GraphQL operations detected in this API call. Each operation is indexed as a JSON object for the name and type of the operation invoked. Null if the request can't be parsed as a valid GraphQL operation.
Type: varchar
Indexed: yes
Example value:
[{"index":1,"type":"QUERY","name":"AllTheNews"},{"index":2,"type":"MUTATION","name":null},{"index":3,"type":"QUERY","name":"LatestNews"}]Count all mutation operations, whether in batches or single operations:
select sum(regexp_count(graphql_operations, '"MUTATION"'))
from resurface.data.messages_index
Count API calls with at least one mutation:
select count(*)
from resurface.data.messages_index
where strpos(graphql_operations, '"MUTATION"') > 0
graphql_operations_count
The size of the graphql_operations collection. Zero when no GraphQL operations are detected. More than one for batched GraphQL operations.
Type: integer
Indexed: yes
Count batches:
select count(*)
from resurface.data.messages_index
where graphql_operations_count > 1
Count total number of operations:
select sum(graphql_operations_count)
from resurface.data.messages_index
graphql_query
The GraphQL query string for a single GraphQL operation. Only present when graphql_operations_count is equal to one, and null in other cases.
Type: varchar
Indexed: no
Example value:
{ hero { name } }Search for exact string match: (fastest but case-sensitive)
select count(*)
from resurface.data.messages
where strpos(graphql_query, 'createUser') > 0
Search with like match: (slower but more expressive)
select count(*)
from resurface.data.messages
where graphql_query like '%createUser%'
Search with regular expression: (slowest but most powerful)
select count(*)
from resurface.data.messages
where regexp_like(graphql_query, '(?i)createUser')
graphql_variables
Optional GraphQL variables passed for a single GraphQL operation. Only present when graphql_operations_count is equal to one, and null in other cases.
Type: varchar
Indexed: yes
host
The host portion of request_url as seen by the API. May be a DNS name or IP address.
Type: varchar
Indexed: yes
Example values:
api.resurface.io
192.168.168.24
Search by value:
select count(*)
from resurface.data.messages_index
where host like '%resurface.io'
Summarize by top 100 values:
select host, count(*) as count
from resurface.data.messages_index
group by host order by count desc limit 100
id
UUID string generated for each message received. This UUID was not present in the original request or response, but can be used to uniquely identify a record in the database.
Type: varchar
Indexed: yes
Example value:
0b94e74c-ecb7-4fa6-98e6-11ab9955eac1Load payload columns for one message id:
select request_body, response_body
from resurface.data.messages
where id = '0b94e74c-ecb7-4fa6-98e6-11ab9955eac1'
Load payload columns for multiple message ids:
select request_body, response_body
from resurface.data.messages
where id in ('0b94e74c-ecb7-4fa6-98e6-11ab9955eac1', ...)
interval_category
Summarizes performance from the user perspective. Calculated from interval_millis.
Type: varchar
Indexed: yes
Allowed values:
Satisfied, Tolerating, Frustrated, UnknownSearch by value:
select count(*)
from resurface.data.messages_index
where interval_category = 'Satisfied'
Summarize by value:
select interval_category, count(*) as count
from resurface.data.messages_index
group by interval_category order by count desc
interval_clique
The grouping used to build response time distributions. Calculated from interval_millis.
Type: varchar
Indexed: yes
Allowed values:
1..250 ms
250..500 ms
500..750 ms
750..1000 ms
1..2 sec
2..3 sec
3..4 sec
4..5 sec
5..6 sec
6..7 sec
7..8 sec
8..9 sec
9..10 sec
10..15 sec
15..20 sec
20..30 sec
Timeout
Unknown
Search by value:
select count(*)
from resurface.data.messages_index
where interval_clique = '500..750 ms'
Summarize by value:
select interval_clique, count(*) as count
from resurface.data.messages_index
group by interval_clique order by count desc
interval_millis
Elapsed milliseconds between the arrival of the request at the API and the completion of the response.
Type: int
Indexed: yes
Search by value:
select count(*)
from resurface.data.messages_index
where interval_millis > 5000
request_address
IP address extracted from one of the request headers below, or null if none of these are present:
- cf-connecting-ip
- fastly-client-ip
- forwarded
- forwarded-for
- true-client-ip
- x-forwarded-for
Type: varchar
Indexed: yes
Search by value:
select count(*)
from resurface.data.messages_index
where request_address = '86.190.33.236'
Summarize by top 100 values:
select request_address, count(*) as total
from resurface.data.messages_index
group by request_address
order by total desc
limit 100
request_body
Original request payload as seen by the API. Automatically decompressed and decoded to a UTF-8 string.
Type: varchar
Indexed: no
Example value:
{"query":"query{\n allNews{\n id\n title\n body\n }\n}"}Search for exact string match: (fastest but case-sensitive)
select count(*)
from resurface.data.messages
where strpos(request_body, 'allNews') > 0
Search with like match: (slower but more expressive)
select count(*)
from resurface.data.messages
where request_body like '%allNews%'
Search with regular expression: (slowest but most powerful)
select count(*)
from resurface.data.messages
where regexp_like(request_body, '(?i)allnews')
request_content_type
Value of the “Content-Type” request header, which indicates the type of body content. https://developer.mozilla.org/en-US/docs/Web/HTTP/Headers/Content-Type
Type: varchar
Indexed: yes
Example value:
application/json; charset=UTF-8Search by value:
select count(*)
from resurface.data.messages_index
where request_content_type like 'application/json%'
Summarize by value:
select request_content_type, count(*) as count
from resurface.data.messages_index
group by request_content_type order by count desc
request_headers
Original request headers as seen by the API. This is a list because the same header name can appear more than once and be associated with more than one value. (like "Cookie" headers)
This list will not include these request headers that are mapped to specific columns:
- "User-Agent" header is mapped to
request_user_agent - "Content-Type" header is mapped to
request_content_type - "X-Forwarded-For" and equivalent headers are mapped to
request_address
Type: varchar
Indexed: no
Example value:
[["content-length","0"],["x-amzn-trace-id","Root=1-5d8195a66013d475f0b19d"],["x-forwarded-port","80"],["x-forwarded-proto","http"]]Search where header is present:
select count(*) as count
from resurface.data.messages
where request_headers like '%["x-forwarded-port"%'
Search where header value is present:
select count(*) as count
from resurface.data.messages
where request_headers like '%["x-forwarded-port","80%'
request_json_type
Calculated by attempting to parse JSON request payloads when request_content_type indicates JSON.
Type: varchar
Indexed: yes
Allowed values:
null                   request_content_type not like 'application/json%'
OBJECT                 successfully parsed as JSON object
ARRAY                  successfully parsed as JSON array
SCALAR                 successfully parsed as JSON scalar value
MALFORMED              JSON parsing failed because of a syntax error
Search by value:
select count(*)
from resurface.data.messages_index
where request_json_type = 'OBJECT'
Summarize by value:
select request_json_type, count(*) as count
from resurface.data.messages_index
group by request_json_type order by count desc
request_method
The type of operation made by the original API request.
Type: varchar
Indexed: yes
Search by value:
select count(*)
from resurface.data.messages_index
where request_method = 'GET'
Summarize by value:
select request_method, count(*) as count
from resurface.data.messages_index
group by request_method order by count desc
request_method_safe
Similar to request_method, but with nonstandard values replaced with "(Invalid)". Attackers may use methods with unexpected values or illegal characters,
and request_method_safe filters these out so the resulting values are safe to display in summary charts.
Type: varchar
Indexed: yes
Search by value:
select count(*)
from resurface.data.messages_index
where request_method_safe = '(Invalid)'
Summarize by value:
select request_method_safe, count(*) as count
from resurface.data.messages_index
group by request_method_safe order by count desc
request_params
Original request parameters as seen by the API. This is a list because the same param name can be associated with more than one value.
Type: varchar
Indexed: yes
Example value:
[["a","fetch"],["content","die(@md5(HelloThinkCMF))"]]Search where param is present:
select count(*) as count
from resurface.data.messages_index
where request_params like '%["content"%'
Search where header value is present:
select count(*) as count
from resurface.data.messages_index
where request_params like '%["content","%'
request_path
Parsed from request_url, this is the path to the resource referenced by the original API request. Always begins with a forward slash but may
include multiple slashes.
Type: varchar
Indexed: yes
Example value:
/blog/latest/new.jsonSearch by value:
select count(*)
from resurface.data.messages_index
where request_path = '/graphql'
Summarize by top 500 values:
select request_path, count(*) as count
from resurface.data.messages_index
group by request_path order by count desc
limit 500
request_path_safe
Similar to request_path, but with nonstandard values replaced with "(Invalid)". Attackers may use paths with illegal characters, and request_path_safe
filters these out so the resulting values are safe to display in summary charts.
Type: varchar
Indexed: yes
Search by value:
select count(*)
from resurface.data.messages_index
where request_path_safe = '/graphql'
Summarize by top 500 values:
select request_path_safe, count(*) as count
from resurface.data.messages_index
group by request_path_safe order by count desc
limit 500
request_port
The network port used to make the original API request. Parsed from request_url.
For http traffic, a null value should be interpreted as port 80.
For https traffic, a null value should be interpreted as port 443.
Type: int
Indexed: yes
Search by value:
select count(*)
from resurface.data.messages_index
where request_port = 8080
Summarize by value:
select request_port, count(*) as count
from resurface.data.messages_index
group by request_port order by count desc
request_protocol
The network protocol used to make the original API request. Parsed from request_url.
Type: varchar
Indexed: yes
Search by value:
select count(*)
from resurface.data.messages_index
where request_protocol = 'http'
Summarize by value:
select request_protocol, count(*) as count
from resurface.data.messages_index
group by request_protocol order by count desc
request_query
The portion of request_url after the first ? character. For many apps this is a highly variable portion of the URL, since this is where any encoded
parameters will appear.
Type: varchar
Indexed: yes
Example value:
token=123&gclid=4625253Search by value:
select count(*)
from resurface.data.messages_index
where request_query like '%token=123%'
Summarize by top 500 values:
select request_query, count(*) as count
from resurface.data.messages_index
group by request_query order by count desc
limit 500
request_url
The complete URL from the original API request — including protocol (usually http or https), port (optional), path, and query string (after the first ? character).
Type: varchar
Indexed: yes
Example value:
https://resurface.io/api/info?token=123Search by value:
select count(*)
from resurface.data.messages_index
where request_url like '%/api/%'
Summarize by top 500 values:
select request_url, count(*) as count
from resurface.data.messages_index
group by request_url order by count desc
limit 500
request_user_agent
Value of the “User-Agent” request header, which indicates the type of agent making the request. https://developer.mozilla.org/en-US/docs/Web/HTTP/Headers/User-Agent
Type: varchar
Indexed: yes
Example value:
curl/7.64.1Search by value:
select count(*)
from resurface.data.messages_index
where request_user_agent like 'curl/%'
Summarize by top 500 values:
select request_user_agent, count(*) as count
from resurface.data.messages_index
group by request_user_agent order by count desc
limit 500
response_body
Original response payload as seen by the API. Automatically decompressed and decoded to a UTF-8 string.
Type: varchar
Indexed: no
Example value:
{ "version": "5.2.2" }Search for exact string match: (fastest but case-sensitive)
select count(*)
from resurface.data.messages
where strpos(response_body, url_encode('certs')) > 0
Search with like match: (slower but more expressive)
select count(*)
from resurface.data.messages
where response_body like '%certs%'
Search by regular expression: (slowest but most powerful)
select count(*)
from resurface.data.messages
where regexp_like(response_body, '(?i)certs')
response_code
Status code returned as part of the response: https://developer.mozilla.org/en-US/docs/Web/HTTP/Status
Type: varchar
Indexed: yes
Example value:
200Search by value:
select count(*)
from resurface.data.messages_index
where response_code = '404'
Summarize by value:
select response_code, count(*) as count
from resurface.data.messages_index
group by response_code order by count desc
response_code_int
Same as response_code but cast to an integer, or null if not a valid integer.
Type: integer
Indexed: yes
Example value:
200Search by value:
select count(*)
from resurface.data.messages_index
where response_code_int = 404
Summarize by value:
select response_code_int, count(*) as count
from resurface.data.messages_index
group by response_code_int order by count desc
response_content_type
Value of the “Content-Type” response header, which indicates the type of body content. https://developer.mozilla.org/en-US/docs/Web/HTTP/Headers/Content-Type
Type: varchar
Indexed: yes
Example value:
application/json; charset=UTF-8Search by value:
select count(*)
from resurface.data.messages_index
where response_content_type like 'application/json%'
Summarize by value:
select response_content_type, count(*) as count
from resurface.data.messages_index
group by response_content_type order by count desc
response_date
The date when the response was generated. Calculated from response_time_mills.
Type: date
Indexed: yes
Example value:
2023-12-01Search using interval function:
select count(*)
from resurface.data.messages_index
where response_date > (current_date - interval '90' day)
Search using value comparison:
select count(*)
from resurface.data.messages_index
where response_date > date('2023-12-01')
response_date_and_hour
The date and hour of day (between 0 and 23) when the API response was generated. Calculated from response_time_millis.
Used to calculate per-hour summaries across multiple days.
Type: varchar
Indexed: yes
Example value:
2023-12-01:22Search by value:
select count(*)
from resurface.data.messages_index
where response_date_and_hour = '2023-12-01:22'
Summarize by value over the last 5 days:
select response_date_and_hour, count(*) as count
from resurface.data.messages_index
where response_date > (current_date - interval '5' day)
group by response_date_and_hour
order by response_date_and_hour
response_date_and_min
The date, hour of day (between 0 and 23), and minute of hour (between 0 and 59) when the API response was generated. Calculated from response_time_millis.
Used to calculate per-minute summaries across multiple hours.
Type: varchar
Indexed: yes
Example value:
2023-12-01:22:53Search by value:
select count(*)
from resurface.data.messages_index
where response_date_and_min = '2023-12-01:22:53'
Summarize by value over the last 6 hours:
select response_date_and_min, count(*) as count
from resurface.data.messages_index
where response_time > (current_timestamp - interval '6' hour)
group by response_date_and_min
order by response_date_and_min
response_day_of_month
The day of the month (between 1 and 31) when the API response was generated. Calculated from response_time_millis.
Type: int
Indexed: yes
Search by value:
select count(*)
from resurface.data.messages_index
where response_day_of_month = 24
Summarize by value:
select response_day_of_month, count(*) as count
from resurface.data.messages_index
group by response_day_of_month order by response_day_of_month
response_day_of_week
The day of the week (between 1 and 7) when the API response was generated. Calculated from response_time_millis.
Type: int
Indexed: yes
Search by value:
select count(*)
from resurface.data.messages_index
where response_day_of_week = 4
Summarize by value:
select response_day_of_week, count(*) as count
from resurface.data.messages_index
group by response_day_of_week order by response_day_of_week
response_headers
Original response headers as seen by the API. This is a list because the same header name can be associated with more than one value. (like "Set-Cookie" headers)
This list will not include request headers like "Content-Type" (which is mapped to response_content_type).
Type: varchar
Indexed: no
Example value:
[["connection","Keep-Alive"],["etag","c561c68d0ba92bbe"],["server","Apache"]]Search where header is present:
select count(*) as count
from resurface.data.messages
where response_headers like '%["etag"%'
Search where header value is present:
select count(*) as count
from resurface.data.messages
where response_headers like '%["etag","c561c68d0ba92bbe"%'
response_hour_of_day
The hour of day (between 0 and 23) when the API response was generated. Calculated from response_time_millis.
Type: int
Indexed: yes
Search by value:
select count(*)
from resurface.data.messages_index
where response_hour_of_day = 8
Summarize by value:
select response_hour_of_day, count(*) as count
from resurface.data.messages_index
group by response_hour_of_day order by response_hour_of_day
response_json_type
Calculated by attempting to parse JSON response payloads when present.
Type: varchar
Indexed: yes
Allowed values:
null                   response_content_type not like 'application/json%'
OBJECT                 successfully parsed as JSON object
ARRAY                  successfully parsed as JSON array
SCALAR                 successfully parsed as JSON scalar value
MALFORMED              JSON parsing failed because of a syntax error
Search by value:
select count(*)
from resurface.data.messages_index
where response_json_type = 'OBJECT'
Summarize by value:
select response_json_type, count(*) as count
from resurface.data.messages_index
group by response_json_type order by count desc
response_status
Summarizes the success or failure of the API response. Calculated based on analysis of the entire response.
Categorizes cases where the response_code is 200 (meaning 'OK') but the response is really not OK.
Type: varchar
Indexed: yes
Allowed values:
Leaking                data leak detected in response headers or body
Malformed              JSON response is not parseable
Redirected             response code is 3XX range
Unauthorized           response code is 401
Forbidden              response code is 403
Throttled              response code is 429
Client Error           response code in 4XX range, except for conditions above
Server Error           response code in 5XX range, except for conditions above
JSON Error             error object detected in JSON response
Completed              response code is 200 and no other problems noted
Search by value:
select count(*)
from resurface.data.messages_index
where response_status = 'Leaking'
Summarize by value:
select response_status, count(*) as count
from resurface.data.messages_index
group by response_status order by count desc
response_time
A native timestamp for when the API response was generated. Calculated from response_time_millis.
Type: timestamp(3) with time zone
Indexed: yes
Example value:
2023-12-01 00:02:44.0Search using interval function:
select count(*)
from resurface.data.messages_index
where response_time > (current_timestamp - interval '90' minute)
Search using value comparator:
select count(*)
from resurface.data.messages_index
where response_time > (timestamp '2023-12-01 00:02:44.0')
response_time_millis
Milliseconds since UNIX epoch (Jan 1 1970).
Type: bigint
Indexed: yes
Example value:
1604475303099Search using value comparator:
select count(*)
from resurface.data.messages_index
where response_time_millis > 1604475303099
risk_category
Summarizes risk associated with the API request and response. Calculated from risk_score.
Type: varchar
Indexed: yes
Allowed values:
High, Medium, LowSearch by value:
select count(*)
from resurface.data.messages_index
where risk_category = 'High'
Summarize by value:
select risk_category, count(*) as count
from resurface.data.messages_index
group by risk_category order by count desc
risk_score
Numeric score for the risk associated with the API request and response. Calculated from all available request and response details.
Type: double
Indexed: yes
Example value:
1.25Search by value:
select count(*)
from resurface.data.messages_index
where risk_score > 1
Get average value:
select avg(risk_score)
from resurface.data.messages_index
session_fields
Fields copied by loggers from the user session active when the response is generated. These fields are not captured by default but can be enabled/filtered using logging rules.
Type: varchar
Indexed: yes
shard_file
Internal partition ID used for replication to Iceberg. Not intended for use by client applications.
Type: varchar
Indexed: yes
size_category
Summarizes approximate size of the request and response as seen by the API. Calculated from size_total_bytes.
Type: varchar
Indexed: yes
Allowed values:
Empty, Tiny, Small, Typical, Large, ExcessiveSearch by value:
select count(*)
from resurface.data.messages_index
where size_category = 'Tiny'
Summarize by value:
select size_category, count(*) as count
from resurface.data.messages_index
group by size_category order by count desc
size_host_bytes
Size in bytes of the host portion of request_url as seen by the API.
Type: int
Indexed: yes
Search by value:
select count(*)
from resurface.data.messages_index
where size_host_bytes > 64
size_request_bytes
Approximate size in bytes of the entire request — including headers, params and body, as seen by the API. All string content will be decoded & decompressed, and so this size may be significantly larger than the amount of data actually received over the network.
Type: int
Indexed: yes
Search by value:
select count(*)
from resurface.data.messages_index
where size_request_bytes > 4096
size_request_body_bytes
Approximate size in bytes of request_body, after decoding/decompressing strings.
Type: int
Indexed: yes
Search by value:
select count(*)
from resurface.data.messages_index
where size_request_body_bytes > 4096
size_request_headers_bytes
Approximate size in bytes of request_headers, after decoding/decompressing strings. Includes JSON padding not present in original request.
Type: int
Indexed: yes
Search by value:
select count(*)
from resurface.data.messages_index
where size_request_headers_bytes > 4096
size_request_params_bytes
Approximate size in bytes of request_params, after decoding/decompressing strings. Includes JSON padding not present in original request.
Type: int
Indexed: yes
Search by value:
select count(*)
from resurface.data.messages_index
where size_request_params_bytes > 4096
size_request_url_bytes
Size in bytes of request_url as seen by the API.
Type: int
Indexed: yes
Search by value:
select count(*)
from resurface.data.messages_index
where size_request_url_bytes > 4096
size_response_bytes
Approximate size in bytes of the entire response — including headers, params and body, as seen by the API. All string content will be decoded & decompressed, and so this size may be significantly larger than the amount of data actually returned over the network.
Type: int
Indexed: yes
Search by value:
select count(*)
from resurface.data.messages_index
where size_response_bytes > 4096
size_response_body_bytes
Approximate size in bytes of response_body, after decoding/decompressing strings.
Type: int
Indexed: yes
Search by value:
select count(*)
from resurface.data.messages_index
where size_response_body_bytes > 4096
size_response_headers_bytes
Approximate size in bytes of response_headers, after decoding/decompressing strings. Includes JSON padding not present in original response.
Type: int
Indexed: yes
Search by value:
select count(*)
from resurface.data.messages_index
where size_response_headers_bytes > 4096
size_total_bytes
Approximate size in bytes of the request and response combined, as seen by the API. All string content will be decoded & decompressed, and so this size may be significantly larger than the amount of data actually received and returned over the network.
Type: int
Indexed: yes
Search by value:
select count(*)
from resurface.data.messages_index
where size_total_bytes > 4096
version
The API version detected at the start of the request_path, or "(none)" if no version was specified. Helpful for tracking deprecated APIs.
Type: varchar
Indexed: yes
Example values:
1
2b
3.0.3
(none)
Search by value:
select count(*)
from resurface.data.messages_index
where version = '3.1c'
Summarize by top 100 values:
select host, version, count(*) as count
from resurface.data.messages_index
group by host, version order by count desc limit 100
Bitmap columns
More than 75 bitmap columns are automatically calculated for every API call. These are included in all indexes to speed query performance when referencing multiple attributes of request and response in a single query. These also help make complex queries more readable.
Type: boolean (no NULLs)
Indexed: yes
Search using single bitmap:
select count(*)
from resurface.data.messages_index
where request_json_present
Search using multiple bitmaps:
select count(*)
from resurface.data.messages_index
where request_json_present and response_json_present
Search using multiple bitmaps and other columns:
select count(*)
from resurface.data.messages_index
where request_json_present and response_json_present and risk_score = 'High'
Available bitmap columns:
request_info_body_present
request_info_content_type_present
request_info_user_agent_present
request_info_hacking_tool
request_info_content_encoding_present
request_info_content_encoding_compressed
request_info_content_length_present
request_info_transfer_encoding_present
request_info_address_present
request_info_address_private
request_info_web_file
request_info_php_file
request_info_host_present
request_info_host_ip_address
request_info_host_ip_private
request_info_host_domain_name
request_info_host_absolute_name
request_info_host_monitored

request_json_present
request_json_is_array
request_json_is_object
request_json_is_scalar

request_graphql_present
request_graphql_batch
request_graphql_call
request_graphql_has_introspection
request_graphql_has_mutation
request_graphql_has_subscription

request_threat_url_insecure
request_threat_content_type_missing
request_threat_body_malformed
request_threat_url_malformed
request_threat_host_malformed

response_info_body_present
response_info_content_type_present
response_info_content_encoding_present
response_info_content_encoding_compressed
response_info_content_length_present
response_info_transfer_encoding_present
response_info_redirected
response_info_unauthorized
response_info_forbidden
response_info_throttled
response_info_error_client
response_info_error_server

response_json_present
response_json_is_array
response_json_is_object
response_json_is_scalar
response_json_error_present

response_leak_system_header
response_leak_directory_listing
response_leak_source_cgi
response_leak_error_java

response_threat_code_malformed
response_threat_body_malformed
response_threat_body_unexpected
response_threat_content_type_missing
response_threat_header_linebreak

attack_request_method_malformed
attack_request_body_unexpected
attack_request_url_linebreak
attack_request_url_unsafe_chars
attack_request_url_unicode
attack_request_url_working_file
attack_request_url_encoding_abuse
attack_request_header_linebreak
attack_request_multiple_connections
attack_request_param_linebreak
attack_request_content_length_malformed
attack_request_content_type_malformed
attack_request_transfer_encoding_unexpected

attack_application_path_traversal
attack_application_remote_file_inclusion
attack_application_restricted_file
attack_application_param_pollution
attack_application_request_smuggling
attack_application_response_splitting
attack_injection_jndi
attack_injection_ldap
Bitmap collections
These columns group related bitmaps together, making these easier to query at once. These are hexadecimal values where bitmaps are encoded in powers of two. So these columns are either compared with zero, or by counting the number of non-zero bits set.
Type: integer (32-bit)
Indexed: yes
Search for all attacks:
select count(*)
from resurface.data.messages_index
where bitmap_attack_bits != 0
Search for completed attacks:
select count(*)
from resurface.data.messages_index
where bitmap_attack_bits != 0 and response_status = 'Completed'
Search for multiple attacks per request:
select count(*)
from resurface.data.messages_index
where bit_count(bitmap_attack_bits, 32) >= 2
Available bitmap collections:
bitmap_request_info
bitmap_request_json
bitmap_request_graphql
bitmap_request_pii
bitmap_request_threat

bitmap_response_info
bitmap_response_json
bitmap_response_leak
bitmap_response_pii
bitmap_response_threat
bitmap_response_failure_bits

bitmap_attack_request
bitmap_attack_application
bitmap_attack_injection
bitmap_attack_bits
Custom views
Custom views are useful for data integrations and reporting that is unrelated to defined signatures.
Custom views are very powerful and expressive:
- Views are based on regular
SELECTstatements and can includeWHERE,GROUP BYandWITHclauses. - Views affect all data in the database, even retroactively before the view was created.
- Views can be based on other views without sacrificing performance.
- Views can introduce new computed columns that aren't present in base views.
Please add any user-defined views to the resurface.custom schema. Do not create custom signatures in other available schemas as these may conflict with
current or future product-defined views.
It's recommended to use INVOKER security, meaning that the permissions of the user executing the view are used, as opposed to the user that defined the
view. Unfortunately INVOKER security is not set by default, so it's important to remember to use this option any time a custom view is created.
Here's an example of a summary query that can be reused by creating a custom view:
create or replace view resurface.custom.calls_by_hour security invoker as
select response_date_and_hour, any_value(response_date) as response_date, count(*) as count
from resurface.data.messages_index
group by response_date_and_hour
order by response_date_and_hour
Show the current definition for a custom view:
show create view resurface.custom.calls_by_hourThis custom view can then be combined with other constraints. Let's find the top 10 peak traffic hours over the last month:
select * from resurface.custom.calls_by_hour
where response_date > (current_date - interval '30' day)
order by count desc
limit 10
Delete a custom view:
drop view resurface.custom.calls_by_hour⚠️ Do not drop any views outside the resurface.custom schema unless instructed by our support team.
Connector functions
Trino has an excellent library for scalar and aggregate functions. The Resurface connector adds a few more.
container_version
This scalar function returns the version of the coordinator container.
Example:
select container_version()histosum
This aggregate function returns a distribution values for a given column, with values summed across a second column.
This is similar to the histogram function, except that histogram counts by one.
histogram(x) = histosum(x,1)
Example:
select risk_category, histosum(risk_category, cast(risk_score as varchar)) as count
from resurface.data.messages_index
group by risk_category
JSON Format
You don’t have to be a big-data expert to load data into your Resurface database. This section covers all the details of our open JSON format, which can be supplied by nearly any data source.
Why use JSON?
Nearly every modern programming language and data processing system provides JSON support without any extra libraries or special dependencies. In many cases building and parsing JSON is actually done via native routines, which are efficient and fast.
Certainly there are other binary formats, like protobuf and BSON, that can have better performance. But these are harder to consume, especially by humans. None of these alternatives are universally available like JSON. Some have too many dependencies that can potentially conflict with your app's existing dependencies. Given all these factors, we think JSON strikes the right balance with good efficiency and excellent ease of use.
JSON grammar
This grammar defines the data structures that are specific to logging API requests and responses.
- Each API call (with request and response details) is a single message.
- Each message is an array of one or more message details.
- Each detail associates a key string with a value string.
- All key strings must be formatted properly based on the type of key.
Here's the geekier way of saying all of that:
message
    [ message-details ]

message-details
    message-detail
    message-detail, message-details

message-detail
    [ "key", "value" ]
Key strings
All key strings are formatted based on the type of key, and whether the key includes an identifying name. Keys with names may appear multiple times in a message, but keys without names appear only once in the message.
Key String              Count   Description
---------------------   -----   ------------------------
custom_field:<name>      0..n   Named custom detail
host                        1   Host identifier
interval                    1   Elapsed service time
now                         1   Response unix timestamp
request_body             0..1   Body content as text
request_header:<name>    0..n   Named header
request_method              1   HTTP method
request_param:<name>     0..n   Param from URL or body
request_url                 1   HTTP url
response_body            0..1   Body content as text
response_code               1   HTTP return code
response_header:<name>   0..n   Named header
session_field:<name>     0..n   Named session detail
By convention, key strings are always all lowercase (including the name portion). This is convenient when using this format and for writing logging rules.
JSON examples
Basic case
This first example shows the minimum number of details to expect for each HTTP request and response. This has URL and timing information but not much else.
[
["request_method","GET"],
["request_url","http://myurl"],
["response_code","200"],
["host","web.1"],
["interval","1.29318200"],
["now","1619848800000"]
]
More realistic case
This second example shows a larger set of key/value details. (By the way, logging rules are used to control how many details are kept and how many are discarded)
[
["request_method", "POST"],
["request_url","http://localhost:5000/?action=new"],
["request_body", "{ \"customerID\" : \"1234\" }"],
["request_header:version","HTTP/1.1"],
["request_header:host","localhost:5000"],
["request_header:connection","keep-alive"],
["request_header:cache-control","max-age=0"],
["request_header:upgrade-insecure-requests","1"],
["request_header:user-agent","Mozilla/5.0..."],
["request_header:accept","text/html,application/xhtml+xml,application/xml"],
["request_header:accept-encoding","gzip, deflate, br"],
["request_header:accept-language","en-US,en;q=0.9"],
["request_header:cookie","_ruby-getting-started_session=MTFxM0tmZG"],
["request_header:if-none-match","W/\"70bd4196dfa68808be58606609ed8357\""],
["request_param:action","new"]
["response_code","200"],
["response_header:x-frame-options","SAMEORIGIN"],
["response_header:x-xss-protection","1; mode=block"],
["response_header:x-content-type-options","nosniff"],
["response_header:content-type","text/html; charset=utf-8"],
["response_header:etag","W/\"1467037e1e8\""],
["response_header:cache-control","max-age=0, private, must-revalidate"],
["response_header:set-cookie","_ruby_session=WHZtbllOcU...; path=/; HttpOnly"],
["response_header:x-request-id","2209f8b1-ed2f-420c-9941-9625d7308583"],
["response_header:x-runtime","0.314384"],
["response_header:content-length","8803"],
["response_body","\n\n\n \n\n\n...\n\n"],
["session_field:session_id","8687e4ba9"],
["session_field:_csrf_token","nMI/JGb4GB"],
["host","web.1"],
["interval","1.29318200"],
["now","1619848800000"]
]
Batching with NDJSON
The JSON format described so far has been used to serialize a single message. When you export or import logger messages into your Resurface database, this is done using NDJSON format, which is an easy way to serialize a long list of messages.
With this format, each line in the file is a valid JSON document. But the entire NDJSON file itself is not valid JSON, because it's not formatted as proper array of comma-separated objects. But if your intent is to read the file one line at a time, each line will be a valid JSON object that can be parsed on its own.
This might seem a little strange to newcomers at first, but this is nicely efficient in cases (like this one) where each message is parsed separately and processed in linear fashion.
The NDJSON files that Resurface imports and exports are always gzipped by convention. These files typically have a high compression ratio, and this greatly improves import and export performance, especially when working with remote databases.
Here's an example of posting a NDJSON batch:
echo '[["now","1619848800001"],["request_method","GET"],["request_url","http://myurl1"],["response_code","200"],["host","web.1"],["interval","1.29318200"]]' > batch.ndjson

echo '[["now","1619848800002"],["request_method","GET"],["request_url","http://myurl2"],["response_code","200"],["host","web.2"],["interval","2.42931820"]]' >> batch.ndjson

gzip batch.ndjson

curl -F "uploaded_file=@$PWD/batch.ndjson.gz" http://localhost:7701/upload
Logging Rules
Getting Started
Installation
Administration
Capturing API Calls
Adding Capacity
SQL Reference
JSON Format
Logging Rules
What are logging rules?
Basic rule syntax
Regular expressions
Keyed rules
Supported rules
Predefined rule sets
Rule ordering and processing
Loading rules from a file
Limitations
Troubleshooting
AWS Tutorials
✉️ Contact support
With Resurface, API calls are always captured in the context of a set of logging rules that govern what kind of data is collected. This section will help when defining logging rules specific to your APIs.
What are logging rules?
With Resurface, logging is always done in the context of a set of rules. These describe when consent has been given to collect user data, and what kinds of data may be collected. All rules are applied within a logger before any usage data is sent to your Resurface database.
Rules can perform many different actions:
- Keeping a random percentage of messages to improve privacy and reduce data volume
- Discarding entire messages based on matching one or more details
- Removing details based on type, name, entire value, or portion of value
- Masking credit card numbers and other sensitive fields regardless of where they appear
- Copying user session fields into the outgoing message
Rules are expressed in code, like a regular part of your application, and so can easily be kept in sync and validated with your app as it changes. Rules are portable between logger implementations in different languages, so they can be shared across your organization.
Best of all, you don't have to be a programmer to create or manage rules for your applications. Rules are expressed with a simple syntax described below.
Basic rule syntax
A set of logging rules is a block of text where:
- each rule appears on a separate line
- rules are identified by name and take zero or more parameters, separated by spaces or tabs
- comments begin with
#and may appear at the start of a line or within a line - blank or empty lines are ignored
- rules may appear in any order
The example below configures two rules and has some helpful comments. Here the sample rule takes parameter 10, while the skip_compression rule takes no parameters.
# example of custom rules

sample 10         # keep 10% at random
skip_compression  # reduce CPU time
Because comments and whitespace are ignored and order of rules is not significant, this next set of rules has exactly the same meaning as the previous example.
skip_compression
      sample     10
All the simplest rules — allow_http_url, include, sample, and skip_compression — take zero or one string parameters, depending on how the rule is defined.
Regular expressions
To create more interesting rules, we rely on regular expressions. These are very flexible and efficient for matching and transforming strings. Regular expressions are also portable between languages, which is ideal for sharing rules across loggers in different languages.
Regular expressions admittedly require some training for the uninitiated, but are far easier to learn than a full-blown programming language. (and we provide lots of helpful examples!)
The following examples are regular expressions delimited with slashes.
/.*/       # match any value
/foo.*/    # starts with foo
/.*foo.*/  # contains foo
/.*foo/    # ends with foo
In our syntax, regular expressions can be written using one of several delimiters: / ~ ! % |
/foo.*/   # starts with foo
~foo.*~   # starts with foo
!foo.*!   # starts with foo
%foo.*%   # starts with foo
|foo.*|   # starts with foo
If a delimiter character appears in a regular expression, then it must be escaped with a preceding backslash. This is where having a choice of delimiters is helpful, as you can pick the one that requires the least amount of escaping. This is great for matching against structured content like JSON or XML or HTML that have different conventions for escaping special characters.
# match 'A/B', with an escaped delimiter (yuck!)
/A\/B/
# match 'A/B', with a different delimiter (better!)
|A/B|Simple rules like copy_session_field take a single regular expression as a parameter, where keyed rules take multiple regular expressions as parameters.
Keyed rules
These rules are the most powerful since they act directly on details of a logged message. A message is internally represented as a list of key/value pairs, which is the same structure used for our JSON format. The following is an example of the key/value pairs for a message.
Key string                                Value string
-------------------------------           --------------------------------------
request_method                            GET
request_url                               http://localhost:5000/?action=new
request_header:user-agent                 Mozilla/5.0...
request_param:action                      new
response_code                             200
response_header:content-type              text/html; charset=utf-8
response_header:content-length            8803
response_body                             { "result": 1 }
session_field:session_id                  8687e4ba9
Keyed rules are those where the first parameter is always a regular expression against a key string. This special regular expression always appears to the left of the name of the rule. These rules will only be evaluated against details where the left-hand regular expression matches the key string.
The following example deletes the response_body detail but keeps the rest.
/response_body/ removeIf the keyed rule takes additional parameters, these appear to the right of the name of the rule, like any regular parameter. The following example is a rule that takes a second regular expression as a parameter.
# remove response bodies containing foo
/response_body/ remove_if /.*foo.*/
Keyed rules are the largest category of rules, featuring: remove, remove_if, remove_if_found, remove_unless, remove_unless_found, replace, stop, stop_if, stop_if_found, stop_unless, stop_unless_found
Supported rules
allow_http_url
By default, loggers will refuse to send messages over HTTP, as this is not secure. Add this rule to allow logger URLs with HTTP to be configured, but be advised this should never be used in real production environments.
allow_http_urlcopy_session_field
This copies data from the active user session into the outgoing message. Only session field names that match the specified regular expression will be copied. Session data is copied before any other rules are run, so that stop and replace rules can inspect session fields just like any detail from the request or response. When no user session is active, nothing will be done.
# copy any available fields
copy_session_field /.*/

# copy any fields starting with 'foo'
copy_session_field /foo.*/
remove
This removes any detail from the message where the specified regular expression matches its key. The value associated with the key is not checked. If all details are removed, the entire message will be discarded before doing any further processing.
# block cookie headers
/request_header:cookie/ remove
/response_header:set-cookie/ remove
remove_if
This removes any detail from the message where the first regular expression matches its key, and the second regex matches its entire value. If all details are removed, the message will be discarded.
# block response body if directed by comment
/response_body/ remove_if |<html>.*<!--SKIP_LOGGING-->.*|
remove_if_found
This removes any detail from the message where the first regular expression matches its key, and the second regex is found at least once in its value. This is faster than matching against the entire value. If all details are removed, the message will be discarded.
# block response body if directed by comment
/response_body/ remove_if_found |<!--SKIP_LOGGING-->|
remove_unless
This removes any detail from the message where the first regular expression matches its key, but the second regex does not match its entire value. If all details are removed, the message will be discarded.
# block response body without opt-in comment
/response_body/ remove_unless |<html>.*<!--DO_LOGGING-->.*|
remove_unless_found
This removes any detail from the message where the first regular expression matches its key, but the second regex is not found at least once in its value. This is faster than matching against the entire value. If all details are removed, the message will be discarded.
# block response body without opt-in comment
/response_body/ remove_unless_found |<!--DO_LOGGING-->|
replace
This masks sensitive user information that appears in message. When the first regular expression matches the key of a message detail, all instances of the second regex in its value will be found and replaced. The third parameter is the safe mask string, which can be just a static value or an expression that includes backreferences. (Please note backreferences are specified in a language-specific manner)
# chop out long sequence of numbers from all details
/.*/ replace /[0-9\.\-\/]{9,}/, /xyxy/

# chop url after first '?' (Node & Java)
/request_url/ replace /([^\?;]+).*/, |$1|

# chop url after first '?' (Python & Ruby)
/request_url/ replace /([^\?;]+).*/, |\\1|
sample
This discards messages at random while attempting to keep the specified percentage of messages over time. The percentage must be between 1 and 99. Sampling is applied only to messages that were not intentionally discarded by any form of stop rule.
sample 10NOTE: Unlike most rules, sample may appear only once in a set of rules.
skip_compression
This disables deflate compression of messages, which is ordinarily enabled by default. This reduces CPU overhead related to logging, at the expense of higher network utilization to transmit messages.
skip_compressionstop
This discards the entire message if the specified regular expression matches any available key. The value associated with the key is not checked.
# block messages if requested via header
/request_header:nolog/ stop
stop_if
This discards the message if the first regular expression matches an available key, and the second regex matches its entire value.
# block messages if directed by body comment
/response_body/ stop_if |<html>.*<!--STOP_LOGGING-->.*|
stop_if_found
This discards the message if the first regular expression matches an available key, and the second regex is found at least once in its value. This is faster than matching against the entire value string.
# block messages if directed by body comment
/response_body/ stop_if_found |<!--STOP_LOGGING-->|
stop_unless
This discards the message if the first regular expression matches an available key, but the second regex fails to match its entire value. If several of these rules are present, then all must be satisfied for logging to be done.
# block messages without url opt-in
/request_url/ stop_unless |.*/fooapp/.*log=yes.*|
stop_unless_found
This discards the message if the first regular expression matches an available key, but the second regex fails to be found at least once in its value. This is faster than matching against the entire value. If several of these rules are present, then all must be satisfied.
# block messages without url opt-in
/request_url/ stop_unless_found |log=yes|
Predefined rule sets
The easiest way to configure rules for a logger is by including a predefined set of rules. This is done with an include statement that gives the name of the set of rules to load. This example includes the current default rules as a starting point.
include defaultPredefined rules cannot be modified, but they can be extended by adding more rules. The next example includes default rules and randomly keeps 10% of all logged messages.
include default
sample 10
As in the example above, you'll often start with a set of predefined rules and then add more rules specific to your applications. Next we'll dive into the predefined sets of rules — strict and debug — and when to use each.
Strict rules
This predefined set of rules logs a minimum amount of detail, similar to a traditional weblog. Interesting details like body content and request parameters and most headers are dropped. You're unlikely to need additional rules to avoid logging sensitive user information, but the trade-off is that not many details are actually retained.
Strict rules are applied by default, either when no rules are specified or when include default is used for most configurations. Redefining the meaning of include default can be done through the logger API for advanced configurations — but unless you've done so, include default and include strict will have the same meaning.
include strict

OR

include default   # strict unless redefined
Actions taken by strict rules:
- Keep URL but strip off any query params (everything after the first
?) - Remove request body, request parameters, and response body
- Remove request headers except User-Agent
- Remove response headers except Content-Length and Content-Type
Debug rules
This predefined set of rules logs every available detail, including user session fields, without any filtering or sensitive data protections at all. Debug rules are helpful for application debugging and testing, but are not appropriate for real environments with real users.
include debugActions taken by debug rules:
- Copy all fields from active session
- Keep all request and response details intact
Rule ordering and processing
Rules can be declared in any order. There is no special priority given to rules declared earlier versus later, nor to rules loaded by an include statement versus declared inline. Rules are always run in a preset order that gives ideal logging performance.
Why is this so crucial? Because if rules were run in declared order, this would force users to remember many important optimizations. Any rule that relies on a partial match (like remove_if_found) should be done before similar rules matching an entire value (like remove_if). Any sampling should be done only after all stop rules have run. Any replace rules are the slowest and should be run last. (and so on) It would be very difficult to create efficient sets of custom rules if ordering was not automatically optimized.
The following algorithm is applied every time a HTTP request/response is logged:
- The logger constructs an outgoing message from original request and response objects
- The logger runs copy_session_field rules to copy data from the user session to the message
- The logger attempts to quit early based on stop rules in the following order: stop, stop_if_found, stop_if, stop_unless, stop_unless_found
- The logger may now randomly discard the entire message based on a sample rule
- The logger discards message details based on remove rules in the following order: remove, remove_unless_found, remove_if_found, remove_unless, remove_if
- The logger discards the entire message if all details have been removed at this point
- The logger runs any replace rules to mask any sensitive fields present
- The logger removes any details with empty values (ie. completely masked out)
- The logger finishes the message by adding
nowandagentandversiondetails - The logger converts the message into a JSON message (with proper encoding and escaping)
- The logger deflates the JSON message unless a skip_compression rule is present
- The logger transmits the JSON message to the intended destination (a remote URL)
Most rules (with the exception of sample) can appear more than once within a set of rules. This is helpful for some complex expressions that would not be possible otherwise. When multiple rules with the same name are present, they all will be run by the logger, but their relative order is not strictly guaranteed.
Loading rules from a file
Rules are passed as a single string argument when creating new logger instances. This works in most cases, especially when using a predefined set of rules, like include strict or include debug . However, it can be both cumbersome to fit a more complex rule set into a single string, as well as inconvenient to modify your codebase when you wish to edit an existing rule set. In order to address these issues, you can create a plain text file containing your rule set and save it in a location reachable by your application. Then, its path is appended to the file:// prefix and passed as the rules string argument to the logger, like so
# example: the rule set can be found at ./app/rules.txt
logger = HttpLogger(rules="file://app/rules.txt")  # python
Limitations
- Some details (host, interval, now) are not visible to rules. These are added after rules have run against the message.
- Rules are not able to change existing key strings, or add new keys (except for copy_session_field rules).
- Rules cannot express certain types of matches between different details. For example, response_body can't be removed based on matching a request_header value.
Troubleshooting
Getting Started
Installation
Administration
Capturing API calls
Adding Capacity
SQL Reference
JSON Format
Logging Rules
Troubleshooting
Not capturing API calls
Cannot connect to Resurface
Accessing container shell
Checking container version
Installing or removing packages
Using supervisorctl
Viewing service logs
Viewing database directory
Editing container files
Enabling debug logging
Resetting modified containers
Setting custom helm values
Setting ConfigMap values
AWS Tutorials
✉️ Contact support
Resurface is designed to look after itself, but is simple to troubleshoot if things aren’t working right. This section covers how to access your Resurface containers and where helpful logs are stored.
Not capturing API calls
Don't worry about configuring data capture until after you've installed your database cluster.
If you're able to connect to the web interface, but are unable to capture any API calls, then try these steps to troubleshoot:
- Double-check that your capture URL is correct
- Note this is different than the URL used to connect to the web interface!
- If the capture URL uses HTTPS, then HTTPS is required to be enabled on the cluster
- Use a browser to connect to the
flukeserverendpoint directly (http://<your-host>/fluke/)- Note the trailing slash is required!
- If able to connect, import a single JSON API call (and verify this is shown in search results)
- If unable to connect, open a shell to the coordinator node and verify that
flukeserveris running
- Verify that configured logging rules are valid
- Invalid logging rules will cause all traffic to be dropped by default!
- Don't use any extra quotes when declaring logging rules
- Start with debug rules first:
include debug
If you're stumped, contact support and we'll help you get data flowing.
Cannot connect to Resurface
This is usually caused by not having enough CPU or memory. Each node requires 6 CPUs and 18 GB of memory to start.
It is not recommended to attempt to reduce CPU or memory requirements, since this will cause other problems.
Use kubectl to show the status of all nodes in your cluster:
kubectl get pods -n resurfaceUse kubectl to show all the details for a specific node:
kubectl describe pod <name> -n resurfaceWhen running properly, all nodes should be in the Running state. If sufficient CPU or memory is not available, one or
more nodes will remain in Pending state. These nodes will automatically start and join the cluster when CPU and memory requirements are satisfied.
If all nodes show a Running status, but you still cannot connect to the Resurface UI, then start a container shell to the coordinator node,
and verify that Trino is running.
If Trino is running, then the problem is likely due to network configuration. Double-check your URL and DNS settings.
If you're stumped, please contact support to open a support case.
Accessing container shell
Some troubleshooting requires connecting to a container, and this is done through kubectl rather than using SSH.
Attach a shell to your coordinator node:
kubectl exec -it resurface-coordinator-0 -n resurface -- bashThis shell runs as the runtime user, just like all the processes running on the container.
When you're done, use exit to leave the container shell.
Checking container version
Connect a shell and use this command to show the installed version:
echo $CONTAINER_VERSIONInstalling or removing packages
The apt utility is disabled on Resurface containers, since this requires root permissions. Installing or upgrading packages is strongly discouraged.
Your containers should be upgraded using helm and not apt.
Using supervisorctl
Under normal circumstances, supervisord will automatically start and stop all the services on the container.
When troubleshooting, use supervisorctl to manually start, stop or restart any specific service.
supervisorctl status
supervisorctl restart flukeserver
supervisorctl restart trino
supervisorctl stop all
supervisorctl start all
Viewing service logs
Each Resurface container has three services at runtime:
supervisordis a control system for all container processesflukeserveris the Resurface capture microservice that accepts and stores API calls in/db/messagestrinois a Trino service that includes the Resurface UI and runs queries against/db/messages
New bash shells start in the /opt/supervisor/logs directory where all container service logs are stored.
supervisor.log      Supervisord logs
flukeserver-*.log   Fluke service logs (data capture)
trino-*.log         Trino service logs (UI and queries)
Viewing database directory
The /db directory is special as this is always mapped to a persistent volume. This is where API call data is stored, as well as custom signatures and other settings.
/db/messages     Storage for API calls
/db/views        Storage for signatures and settings
/db/uploads      Temporary storage for files uploaded for importing
/db/postgresql   Storage for Iceberg JDBC catalog (optional)
Editing container files
Your shell will run as the runtime user, which does not have root permissions. Commands like sudo and su will not work. However, most files related to Resurface are owned by the runtime user, and in rare cases these may require minor changes for troubleshooting. The nano editor is preinstalled in case you prefer this over vi.
⚠️ Any changes you make directly to the container's file system outside the /db directory will be lost when the container is recreated or upgraded. Only files in the /db directory are persistent across upgrades.
Delete all signatures:
rm /db/views/runtime.*.json && supervisorctl restart trinoEnabling debug logging
Edit the 'log.properties' file to configure debug output for internal classes:
nano /opt/trino/etc/log.propertiesAll classes have INFO or ERROR level logging by default. Change any of these to DEBUG to see additional details:
io.resurface.ResurfaceResourcefor query debuggingio.resurface.SparklinePollerfor summary debuggingio.resurface.IcebergPollerfor Iceberg replication detailsio.trinofor core Trino functionsorg.apache.icebergfor Iceberg integration functions
After saving changes to log.properties, restart Trino to use the new settings:
supervisorctl restart trinoResetting modified containers
If you made changes to your containers that are no longer needed for troubleshooting, you don't have to manually revert those changes. Simply reset your cluster back to a clean state, while preserving all user settings and captured API calls:
$ helm get values resurface -n resurface -o yaml > values-backup.yml; helm uninstall resurface -n resurface; helm repo update; helm install resurface resurfaceio/resurface -n resurface -f values-backup.yml --reset-valuesSetting custom helm values
Resurface automatically uses platform-specific default settings, which are tuned for best performance and stability.
In rare cases, custom values can be set using helm upgrade in two ways:
--setspecifies a single custom value as a command-line parameter. These are applied left to right.--valuesor-fspecifies an external YAML file with custom values. If multiple files are specified, the rightmost file will take precedence.
⚠️ When both styles are used simultaneously, --set values take precedence over --values files.
You can find a complete list of all supported chart values in our ArtifactHub documentation.
Setting ConfigMap values
The majority of configuration settings are managed automatically by helm, but some low-level settings are managed through Kubernetes ConfigMaps, which are persistent settings that are mapped into a container at runtime. Nodes will be restarted when these settings are changed.
export KUBE_EDITOR=nano

kubectl -n resurface edit configmap/trino-coordinator-config

kubectl -n resurface edit configmap/trino-worker-config
AWS Tutorials
Quickstart tutorial
Requirements
- An AWS subscription
- An EKS cluster with:
- At least one node group that uses the
c7gd.2xlarge(or a larger compute-optimized) instance type. - The
Amazon EBS CSI Driveradd-on enabled and active.
- At least one node group that uses the
- aws, kubectl and helm CLI tools
- At least one source of API traffic to capture from.
Pre-installation
Before installing Resurface, make sure you have access to your EKS cluster. Start by defining a couple environment variables. Be sure to replace YOUR_EKS_CLUSTER_AWS_REGION with the AWS Region that your cluster is in and replace YOUR-EKS-CLUSTER-NAME with the name of your cluster
export EKS_CLUSTER_NAME="YOUR-EKS-CLUSTER-NAME"

export AWS_REGION="YOUR_EKS_CLUSTER_AWS_REGION"
Then, update your local kubeconfig
aws eks update-kubeconfig --name $EKS_CLUSTER_NAME --region $AWS_REGIONVerify your configuration
kubectl get nodes

# Sample output
#NAME                                          STATUS   ROLES    AGE   VERSION
#ip-172-31-20-215.us-west-2.compute.internal   Ready    <none>   10m   v1.25.7-eks-a59e1f0
#ip-172-31-36-244.us-west-2.compute.internal   Ready    <none>   10m   v1.25.7-eks-a59e1f0
Then, make sure to add the resurfaceio repository to your local Helm installation
helm repo add resurfaceio https://resurfaceio.github.io/containersAnd update it to get the latest vesions of the resurfaceio/resurface Helm chart
helm repo updateYou are ready to install Resurface! 🧰
Installation
It only takes a single helm command to install the latest stable version of Resurface on your EKS cluster:
helm install resurface resurfaceio/resurface --create-namespace --namespace resurface --set provider=awsIf you'd also like to try the newest features from our pre-release chart, including automatic AWS VPC Traffic Mirror session creation, you can do so with the following command:
helm upgrade -i resurface resurfaceio/resurface --create-namespace --namespace resurface --set provider=awsWait for a couple seconds and you should be greeted with an output similar to this:
(...)

NAMESPACE: resurface
STATUS: deployed
REVISION: 1
NOTES:
Resurface has been successfully installed.

· Your helm release is named resurface.
· You are running Resurface version 3.5.4 in single-node configuration.
· Iceberg storage is disabled.

· TLS is not enabled.
· Authentication is not enabled.

(...)
Then, just run the following command to get your database URL, and paste into your browser to access the Resurface web UI:
echo http://$(kubectl get svc resurface-kubernetes-ingress --namespace resurface --template "{{ range (index .status.loadBalancer.ingress 0) }}{{.}}{{ end }}")/ui/Once in your browser, you'll be greeted with a Login screen. Auth is disabled by default, so you can use any Username, and Password is not needed.

Then, you'll be required to enter your license key

After you've pasted your license key and read and accepted the corresponding license agreement, you should be greeted with the following screen

Yay! You have installed your very own Resurface instance 🎉
Now let's get some data in it 📈
Capturing API traffic
Depending on the environment you are leveraging to run the applications serving your APIs, there are multiple API traffic capture integrations to pick from:
| API traffic source | Recommended capture option | |||
|---|---|---|---|---|
| EC2 instances Auto-Scaling groups EC2-based ECS tasks |
AWS VPC traffic mirroring | |||
| FARGATE-based ECS tasks | Network-packet sniffer sidecar | |||
| EKS pods and services | Network-packet sniffer DaemonSet | |||
| AWS API Gateway backend apps | AWS CloudWatch + Kinesis Data Stream | |||
| E2E-encrypted applications | Instrumentation application loggers |
In order to get you started capturing data for your brand new Resurface installation, we present you with three capture examples down below: Sniffer DaemonSet, VPC mirroring, and Sniffer Sidecar on ECS
+ Capture Example: Sniffer DaemonSet
In the following example, we'll deploy a sample application to our EKS cluster, and configure the Resurface Sniffer DaemonSet to capture API calls directly from the service exposing it.
First, copy the following yaml
apiVersion: apps/v1
kind: Deployment
metadata:
  name: httpbin-deploy
spec:
  replicas: 1
  selector:
    matchLabels:
      app: httpbin
  template:
    metadata:
      labels:
        app: httpbin
    spec:
      containers:
      - name: httpbin
        image: keyglitch/go-httpbin-arm
        imagePullPolicy: IfNotPresent
        ports:
        - containerPort: 8080
---
apiVersion: v1
kind: Service
metadata:
  name: httpbin-svc
spec:
  selector:
    app: httpbin
  ports:
  - name: http
    port: 80
    targetPort: 8080
  type: LoadBalancer
  externalTrafficPolicy: Local
And save it into a file named httpbin.yaml. In this manifest we are defining both a Kubernetes deployment (in charge of creating Pods) and a Kubernetes service (in charge of exposing them to the internet).
Then, let's create a new Kubernetes namespace and place our Kubernetes objects in it:
kubectl create ns httpbin && kubectl apply -f httpbin.yaml -n httpbin

# Expected output:
#namespace/httpbin created
#deployment.apps/httpbin-deploy created
#service/httpbin-svc created
Now, let's create another file with the sniffer configuration for Resurface. To do so, copy the following yaml:
sniffer:
  enabled: true
  discovery:
    enabled: false
  logger:
    rules: include debug
  services:
  - name: httpbin-svc
    namespace: httpbin
And save it into a file named sniffer-values.yaml
With these values we are both telling the sniffer to enable itself (sniffer.enabled=true), and to capture all data without filtering or masking any fields (sniffer.logger.rules="include debug"). We are also disabling the sniffer discovery feature (sniffer.discovery.enabled=false) and indicating which specific service to capture API calls from. For a complete reference on the values supported by the resurfaceio/resurface Helm chart, refer to the chart's README.
Now, we can upgrade our helm release with the following command:
helm upgrade resurface resurfaceio/resurface -n resurface -f sniffer-values.yaml --reuse-values🏁 At this point you have both successfully installed Resurface and configured its K8s Sniffer DaemonSet to capture API traffic. Hurray!
Perform a couple API calls to the httpbin-svc using curl and see them show up in your Resurface instance
# Get the Base URL for the httpbin-svc
httpbin_base_url=$(kubectl get svc httpbin-svc -n httpbin --template '{{ index (index .status.loadBalancer.ingress 0) "hostname" }}')

# Make an API call to its /json endpoint
curl "http://${httpbin_base_url}/json"
+ Capture Example: VPC mirroring
VPC Traffic Mirroring is an AWS service where inbound and outbound traffic from network interfaces attached to EC2 instances is copied and sent to the network interface of another instance.
In the following example, we are going to have a few sample applications running on:
- Stand-alone EC2 instances
- EC2 instances from Auto-Scaling Groups
- EC2-based ECS tasks
In order for your Resurface instance to receive mirrored traffic, traffic mirror sessions must be configured for each EC2 instance (acting as a traffic source), with one ENI attached to any node of your EKS cluster acting as traffic mirror target. For more information on how to do that manually, please take a look at our "Capturing API Calls with AWS VPC Mirroring" guide.
We'll be using the automatic AWS VPC Traffic Mirror session creation feature included in the latest release of our resurfaceio/resurface chart. When enabled and configured, a CronJob will periodically create traffic mirror sessions for one or more traffic sources (if supported), it will update the list of VNIs used by the sniffer for all active mirror sessions, and it will restart the DaemonSet accordingly.
First, we need to define our traffic sources:
| Traffic source | Value type | Example | |
|---|---|---|---|
| Stand-alone EC2 instances | Comma-separated list of IDs of all EC2 instances | i-0f41ea83087f6dfc3,i-051c356219cec0099,i-07f7f71d77e9a8d42 | |
| EC2 instances from auto-scaling groups | Comma-separated list of names of all auto-scaling groups | asg-1,qa-nodes-bae3e2 | |
| EC2-based ECS tasks | ECS cluster name (required) | ecs-qa | |
| EC2-based ECS tasks | Comma-separated list of ECS tasks (optional) | arn:aws:ecs:us-east-1:452964522007:task/ecs-qa/09f8943fe0b1d1,arn:aws:ecs:us-east-1:452964522007:task/ecs-qa/f1265453a967d6 |
Then, an inline policy with the following permissions must be added to the IAM Role used by your EKS cluster nodes:
"autoscaling:DescribeAutoScalingGroups",
"ec2:AuthorizeSecurityGroupEgress",
"ec2:AuthorizeSecurityGroupIngress",
"ec2:CreateTrafficMirrorFilter",
"ec2:CreateTrafficMirrorFilterRule",
"ec2:CreateTrafficMirrorTarget",
"ec2:CreateTrafficMirrorSession",
"ec2:DescribeInstances",
"ec2:DescribeNetworkInterfaces",
"ec2:DescribeTrafficMirrorFilters",
"ec2:DescribeTrafficMirrorTargets",
"ec2:DescribeTrafficMirrorSessions",
"ec2:ModifyTrafficMirrorSession",
"ecs:ListTasks",
"ecs:DescribeTasks",
"ecs:DescribeContainerInstances",
"eks:ListNodegroups",
"eks:DescribeNodegroup"
Now, let's create a file named sniffer-mirror-values.yaml with the sniffer configuration for Resurface:
sniffer:
  enabled: true
  logger:
    rules: include debug
  vpcmirror:
    enabled: true
    ports: [ 80, 8000, 3000, 9001 ]
  autosetup:
    enabled: true
    source:
      ecs:
        cluster: ecs-qa
      ec2:
        instances:
        - i-0f41ea83087f6dfc3
        - i-051c356219cec0099
        - i-07f7f71d77e9a8d42
        autoscaling:
        - asg-1
        - qa-nodes-bae3e2
    target:
      eks:
        cluster: eks-qa
With these values we are both telling the sniffer:
- To enable itself (
sniffer.enabled=true) - To capture all data without filtering or masking any fields (
sniffer.logger.rules="include debug") - To enablie the VPC mirrored traffic capture feature (
sniffer.vpcmirror.enabled=true) - Which specific ports our applications are being served from (e.g.
80,8000,3000, and9001) - To enable the automatic traffic mirror session creator job (
sniffer.autosetup.enabled=true), and passing the traffic sources we defined before. - The name of the EKS cluster where the Resurface instance is running in order for the job to create the corresponding mirror target (
sniffer.autosetup.target.eks.cluster=eks-qa).
For a complete reference on the values supported by the resurfaceio/resurface Helm chart, refer to the chart's README.
Now, we can upgrade our helm release with the following command:
helm upgrade resurface resurfaceio/resurface -n resurface -f sniffer-values.yaml --reuse-values🏁 At this point you have successfully installed Resurface, configured its Sniffer DaemonSet to capture VPC mirrored API traffic, and also configured a CronJob to update both traffic mirror sessions as well as the sniffer configuration automatically. Nice!
(Try updating one of your ECS task definitions! Next time the CronJob runs, mirror sessions will be automatically created for any new tasks, and mirrored traffic will show up in your Resurface instance.)
+ Capture Example: Sniffer Sidecar on ECS
AWS VPC Traffic Mirroring has its own limitations. In particular, Traffic Mirroring is available on a majority of the current generation EC2 instances but not on all instance types (more info here). This can be a challenge for FARGATE-based ECS deployments, as the AWS FARGATE service uses any available EC2 instances capable of runing the specified containerized workloads but it doesn't guarantee the chosen instances will be amongst those that support VPC mirroring.
So, what about those ECS tasks that use a FARGATE launch type? Worry not. We have a solution and its name is Sniffer Sidecar.
In the following example, we have a couple FARGATE-based ECS tasks running replicas of the kennethreitz/httpbin containerized app. As these are not necessarily supported by AWS VPC mirroring sessions, we are going to modify the task definition in order to add the Resurface sniffer as a sidecar container:
First, we will need to define three environment variables:
| Variable | Set to | Example | ||
|---|---|---|---|---|
USAGE_LOGGERS_URL |
Capture URL endpoint for your Resurface cluster | https://pepper.boats/fluke/message | ||
USAGE_LOGGERS_RULES |
Logging rules | include debug |
||
APP_PORTS |
Comma-separated list of all the ports serving the apps in the task definition | 80 |
In this example, our Resurface instance is located at https://pepper.boats/, the httpbin app is exposed on port 80 and we've set the logging rules to include debug as to capture all unfiltered and unmasked API calls.
You might want to set USAGE_LOGGERS_RULES field to
include debug\n/request_header:user-agent/ stop_if_found /Resurface/to prevent it from capturing internal Resurface traffic, in case AWS FARGATE deploys the containers in the same EC2 instances running as K8S nodes in your EKS cluster.
Now, let's go to the AWS ECS console and take a look at the task definitions:

Let's create new revision for httpbin-task-definition:

Add the resurfaceio/network-sniffer:1.3.0 image with the environment variables we defined before:

Make sure to increase the task size by 1 vCPU and 2 GB of memory. These extra resources are the suggested reservations for the network-sniffer container.

Click Create. Finally, update the EKS service to create tasks using the new task definition.
🏁 At this point you have both successfully installed Resurface and configured an ECS task definition to use the Resurface Sniffer to capture local API traffic. Let's go!
Capturing FARGATE API traffic on AWS: Sniffer sidecar tutorial for ECS
Requirements
- An AWS subscription
- An ECS Cluster with at least one task definition comprised of at least one application exposed through one or more ports.
- At least 1 extra vCPU and 2 GB of memory. These constitute the compute and memory requirements for the
network-sniffercontainer.
Network Sniffer
The Resurface network-sniffer container used by the Sniffer DaemonSet works as a network-level packet-sniffer application, being able to capture packets directly from network interfaces. It can reassemble the packets, parse both HTTP request and response, package entire batches of API calls, and send them to your Resurface DB instance automatically.
Our sniffer can not only be deployed as a Kubernetes DaemonSet, but also as a sidecar to other containerized applications. It only needs to able to access the same network devices in userspace in order to capture packets "directly from the wire". This makes it a great solution for AWS ECS deployments, as containers in the same ECS task will share the same network interfaces by default.

Configuring the sniffer
In order to set up the Resurface sniffer as a sidecar container, you need to define three environment variables:
| Variable | Set to | Example |
|---|---|---|
USAGE_LOGGERS_URL |
Capture URL endpoint for your Resurface cluster | https://pepper.boats/fluke/message |
USAGE_LOGGERS_RULES |
Logging rules to mask or remove sensitive fields | include debug |
APP_PORTS |
Comma-separated list of all ports exposed by the other container(s) inside the task definition | 80 |
Updating an ECS task definition
First, let's go to the AWS ECS console and take a look at the task definitions:

Next, create a new revision for the task definition you would like to capture API traffic from. In this example, that task definition is httpbin-task-definition:

Add a new container by clicking +Add more containers
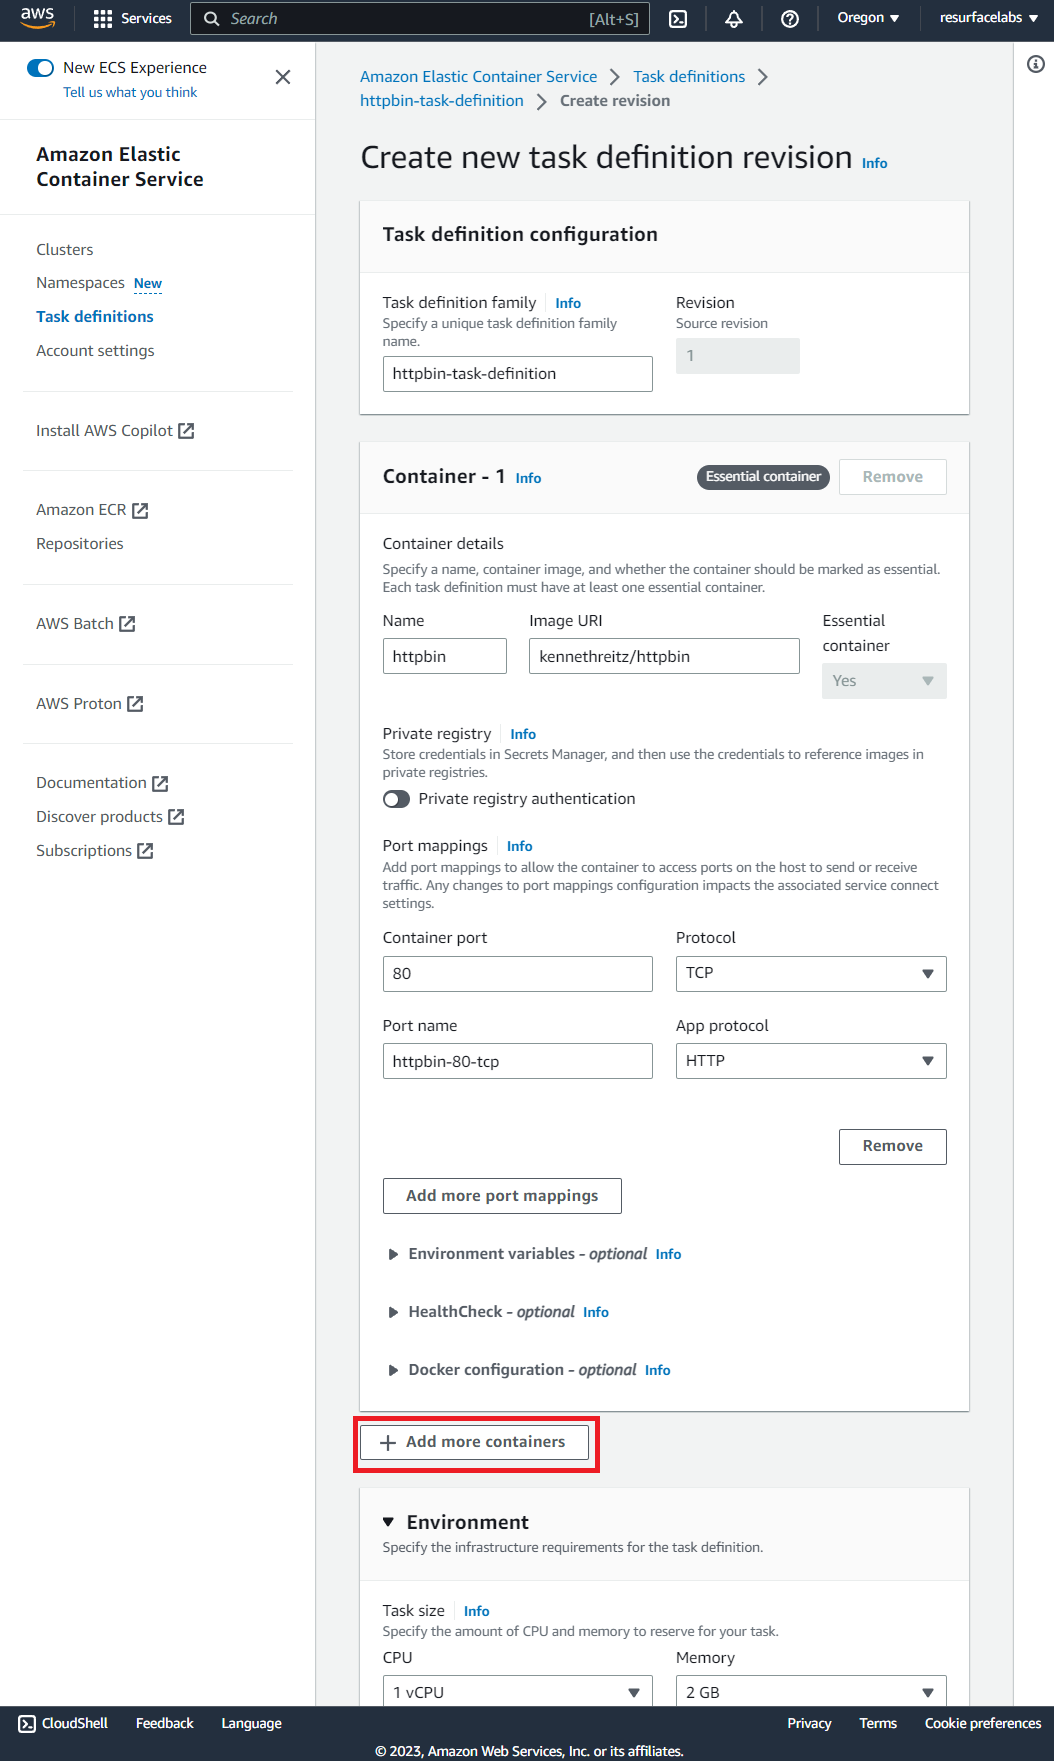
Add the resurfaceio/network-sniffer:1.3.0 image with the environment variables you defined before

Make sure to increase the task size by 1 vCPU and 2 GB of memory. These extra resources are the suggested reservations for the resurfaceio/network-sniffer:1.3.0 container.
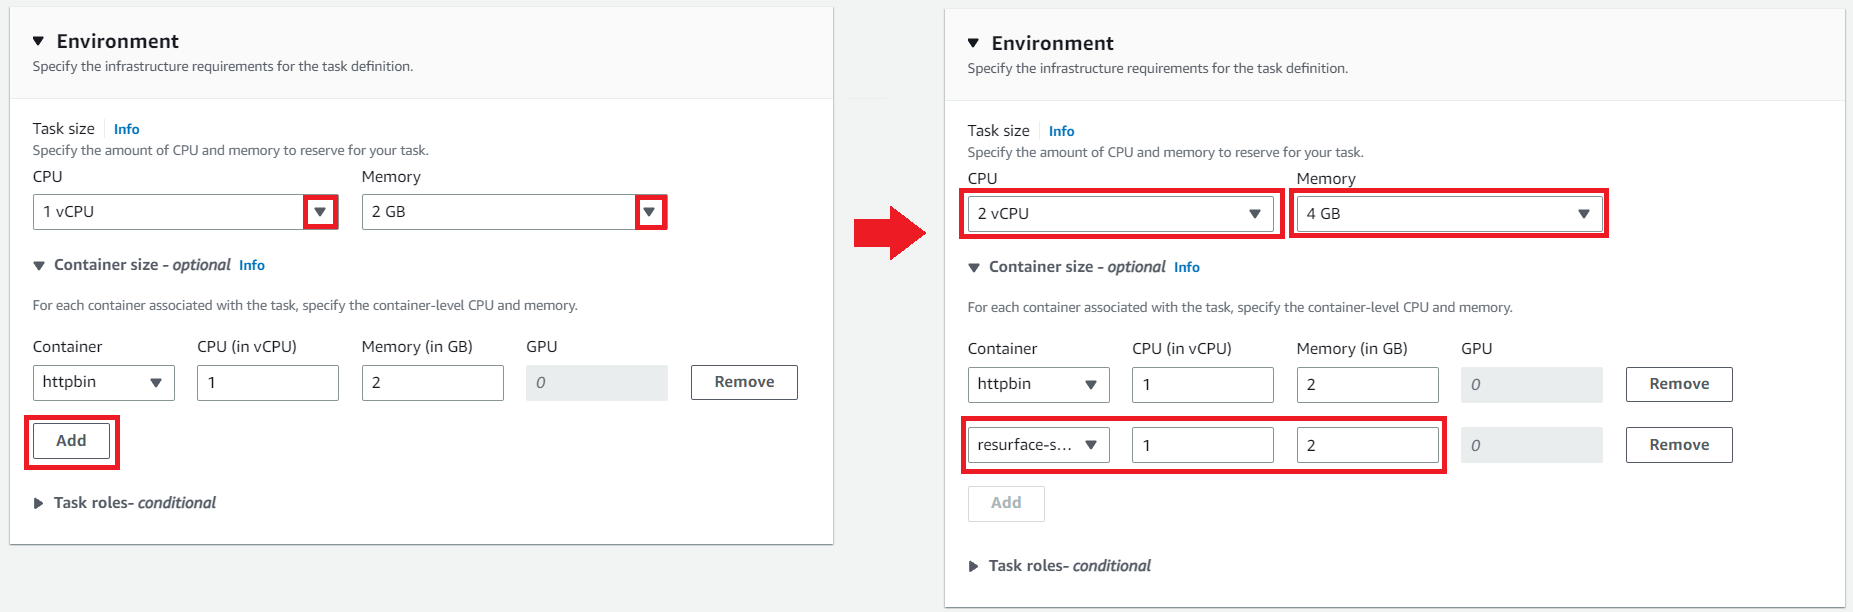
Click Create.

🏁 That's it! Now you need to update the ECS service and/or tasks accordingly to create tasks using the new task definition.

Updating an ECS task definition using JSON
You can update your task definition directly by editing its corresponding JSON file. Just mpdify the fields indicated in the JSON object below. Remember to replace the values for each environment variable as it applies to your case!
{
  "containerDefinitions": [
        {
            "name": "httpbin",
            "image": "kennethreitz/httpbin",
            "cpu": 1024,
            "memory": 2048,
            "portMappings": [
                {
                    "name": "httpbin-80-tcp",
                    "containerPort": 80,
                    "hostPort": 80,
                    "protocol": "tcp",
                    "appProtocol": "http"
                }
            ],
            "essential": true,
            "environment": [],
            "environmentFiles": [],
            "mountPoints": [],
            "volumesFrom": []
        },
        {
            "name": "resurface-sniffer",
            "image": "resurfaceio/network-sniffer:1.3.0",
            "cpu": 1024,
            "memory": 2048,
            "portMappings": [],
            "essential": false,
            "environment": [
                {
                    "name": "USAGE_LOGGERS_RULES",
                    "value": "include debug"
                },
                {
                    "name": "APP_PORTS",
                    "value": ""
                },
                {
                    "name": "USAGE_LOGGERS_URL",
                    "value": "https://pepper.boats/fluke/message"
                }
            ],
            "environmentFiles": [],
            "mountPoints": [],
            "volumesFrom": []
        }
    ],
    "cpu": "2048",
    "memory": "4096",
}
🏁 That's it! Now you need to save a new revision, and update the ECS services and/or tasks accordingly.
Capturing API traffic on AWS: VPC mirroring
Requirements
- A Resurface instance up and running
- An AWS subscription
- Access to the ENI of the instance (EC2 or FARGATE) running your API's backend application.
It’s recommended to use nitro-based hypervisor EC2 instance types, since the VPC mirroring feature might not work on other types, like T2. Learn more
Mirroring API Calls to an EKS node
Traffic Mirroring copies inbound and outbound traffic from the network interfaces that are attached to your compute instances (EC2 or FARGATE) and sends it to the network interface of another instance. In order for your Resurface instance to receive this mirrored traffic, we need to configure a traffic mirror session with an ENI attached to any node of your EKS cluster acting as traffic mirror target.
Traffic Mirroring can be configured with both the traffic mirror source and the traffic mirror target in the same VPC, or they can be in different VPCs.
EKS cluster in the same VPC as mirror source
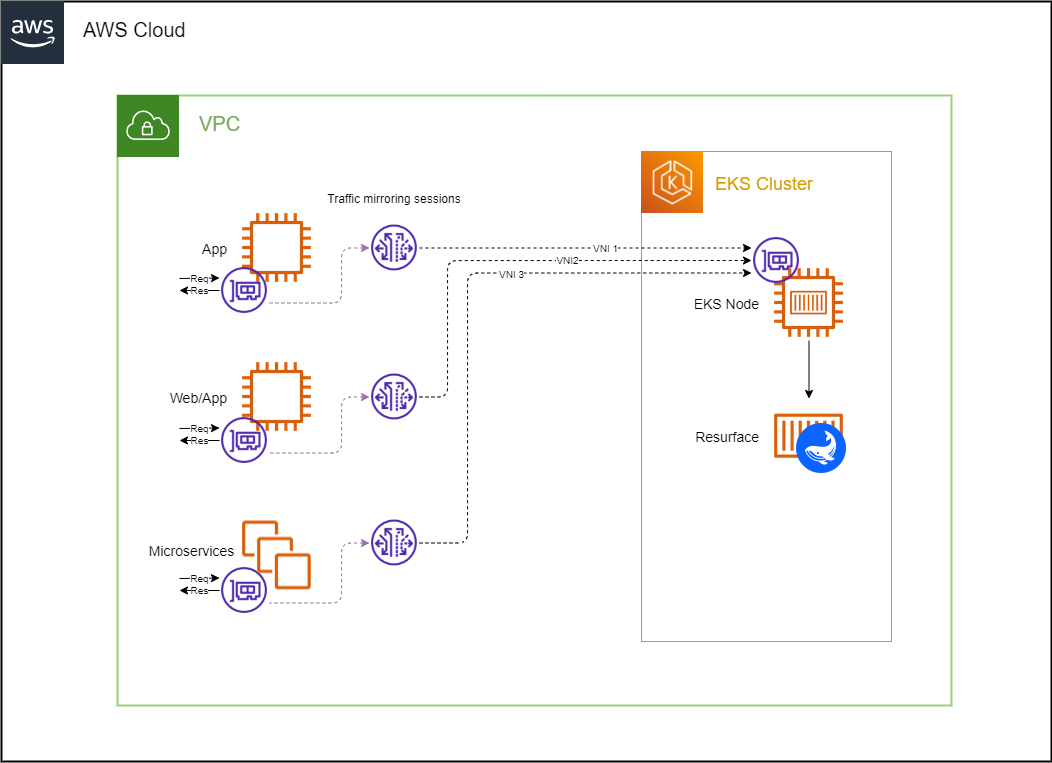
Click the button below to deploy all the necessary resources automatically as a CloudFormation stack:
This stack consists of a mirror session, filter and target, as well as an inbound rule to add to your EKS security group. In order for the stack to be properly deployed, you must specify the following parameters:
+ Source Network Interface ID
ID of the Elastic Network Interface to mirror traffic from. This ENI should be attached to the instance where your application is running.
EC2 instance:

ECS FARGATE task:


+ Destination Network Interface ID
ID of the Elastic Network Interface to receive the mirrored traffic. This ENI should be attached to any of the EC2 instances from any node group in you EKS cluster.
NOTE: ENIs created by the vpc-cni add-on (interfaces named
aws-K8S-i-<EC2 instance ID>) are not currently supported.


+ Source Security Group ID
ID of the Security Group attached to the instance to mirror traffic from.
EC2 instance:

ECS FARGATE task:

+ Destination Security Group ID
ID of the Security Group attached to the instance to receive mirrored traffic.

+ Virtual Network ID
Mirrored traffic is encapsulated using VXLAN. A VXLAN Network Identifier (VNI) is used to identify the VXLAN segments in the mirrored packets. Take note of this number; you will need it in the next section.
Click on Create Stack. Wait until the stack status becomes
CREATE_COMPLETE.Upgrade your helm release to capture the mirrored traffic using a network sniffer.
EKS cluster in a different VPC
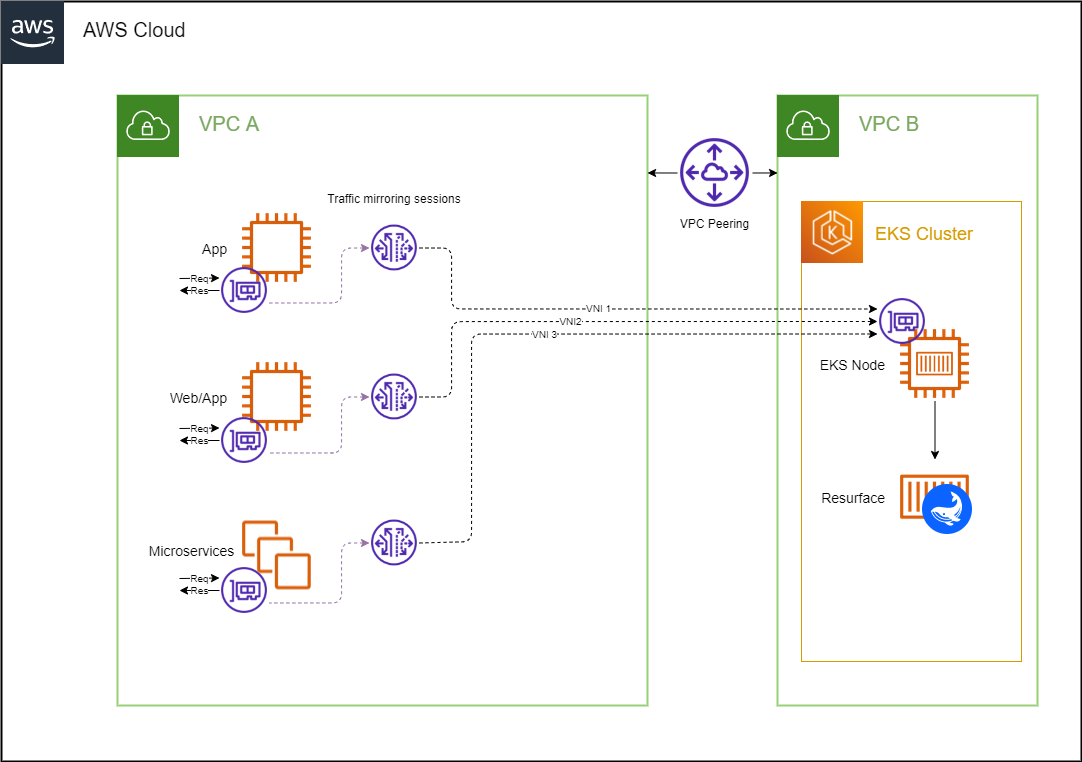
You might want to isolate different parts of your infrastructure by deploying your EKS cluster in a new VPC. Traffic mirroring can be achieved within different VPCs that are connected through VPC peering.
Click the button below to deploy all the necessary resources automatically as a CloudFormation stack:
This stack consists of a VPC peering connection, including a Route to your Resurface VPC, together with a mirror session, filter and target, as well as an inbound rule to add to your EKS security group. In order for the stack to be properly deployed, you must specify the following parameters:
+ Source VPC ID
ID of the VPC that corresponds to the instances you wish to mirror traffic from.

+ Source VPC Route Table ID
ID of the Route Table associated with the subnet in which your instance resides.
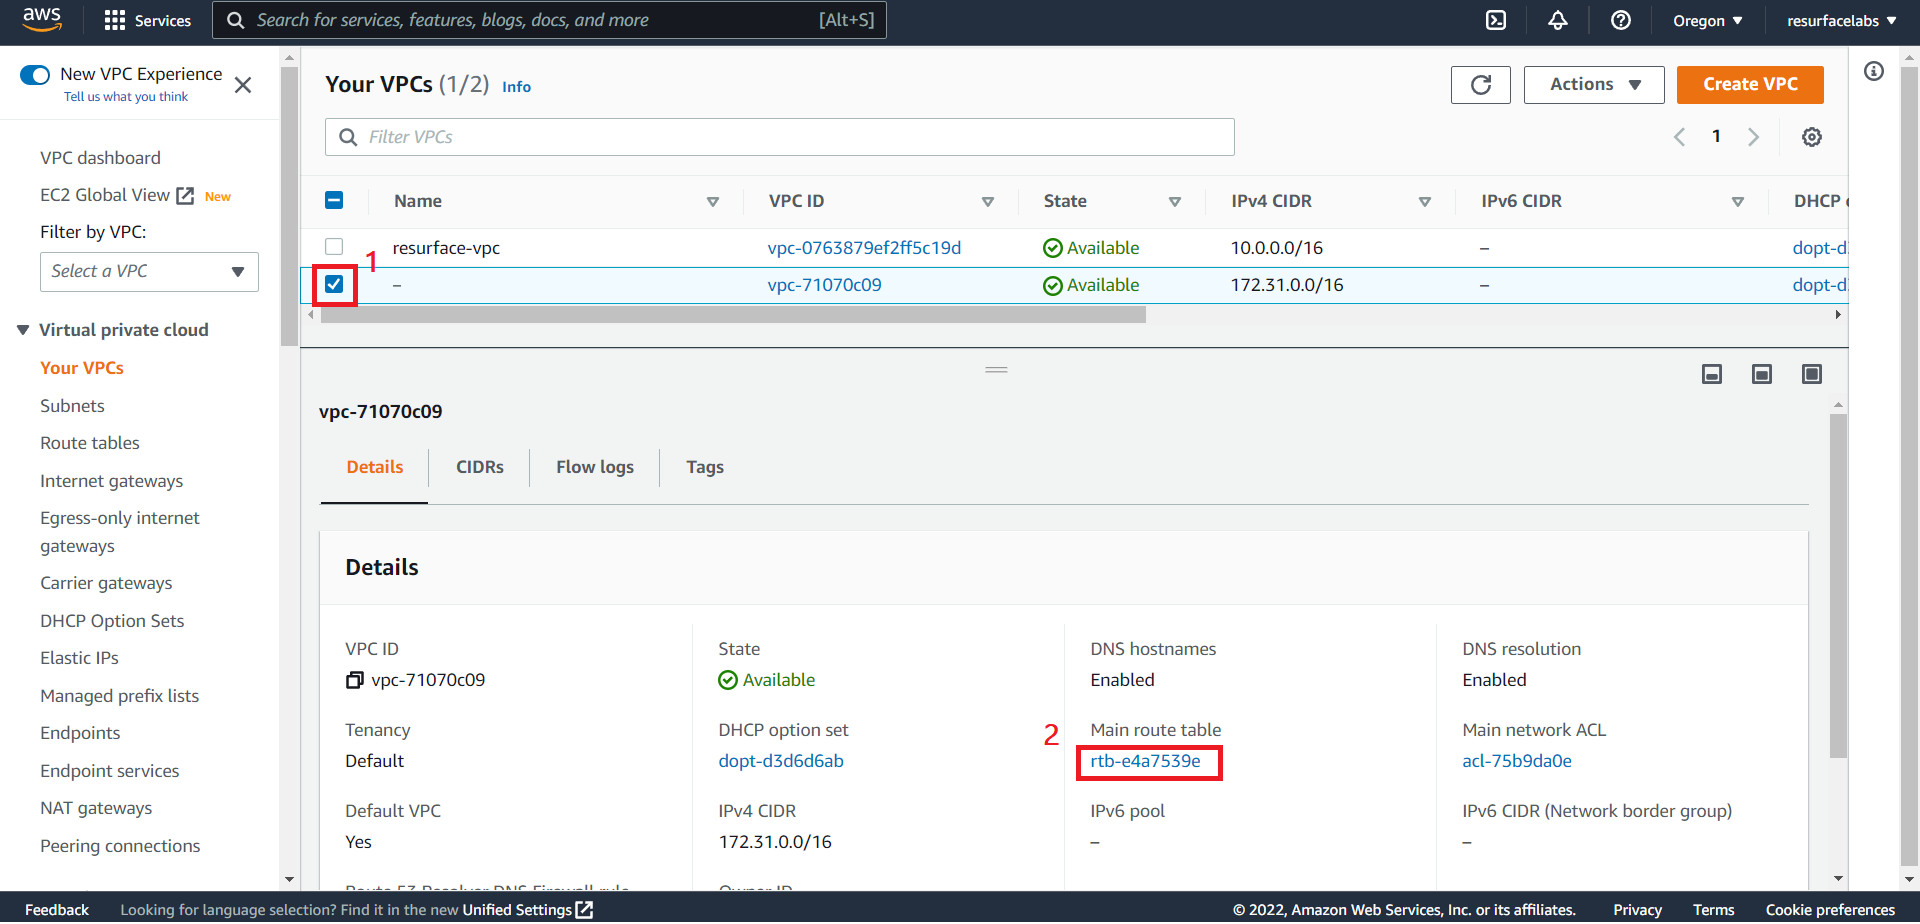
+ Resurface VPC ID
ID of the VPC in which the EKS cluster running your Resurface instance resides.

+ Resurface VPC CIDR Block
CIDR block of the VPC in which the EKS cluster running your Resurface instance resides.

+ Source Network Interface ID
ID of the Elastic Network Interface to mirror traffic from. This ENI should be attached to the EC2 instance or FARGATE task where your application is running.

+ Destination Network Interface ID
ID of the Elastic Network Interface to receive the mirrored traffic. This ENI should be attached to any of the EC2 instances from any node group in you EKS cluster.
NOTE: ENIs created by the vpc-cni add-on (interfaces named
aws-K8S-i-<EC2 instance ID>) are not currently supported.


+ Source Security Group ID
ID of the Security Group attached to the instance to mirror traffic from.

+ Destination Security Group ID
ID of the Security Group attached to the instance to receive mirrored traffic.

+ Virtual Network ID
Mirrored traffic is encapsulated using VXLAN. A VXLAN Network Identifier (VNI) is used to identify the VXLAN segments in the mirrored packets. Take note of this number; you will need it in the next section.
Click on Create Stack. Wait until the stack status becomes
CREATE_COMPLETE.Upgrade your helm release to capture the mirrored traffic using a network sniffer.
Capturing mirrored API Calls
Once you have a traffic mirroring session, a network packet sniffer can be deployed as a DaemonSet (i.e. one pod per node) in order to capture mirrored traffic.
Create a
vpcm.yamlfile with the following structure:sniffer: enabled: true logger: rules: include debug vpcmirror: enabled: true vnis: [ Sequence of VNIs ] ports: [ Sequence of port numbers ]In our case, if we assume the application we want to mirror traffic from is being served on port
8000, ourvpcm.yamlfile looks like this:sniffer: enabled: true logger: rules: include debug vpcmirror: enabled: true vnis: - 123 ports: - 8000The
sniffer.vpcmirror.vnisvalue refers to a list containing the Virtual Network IDs from all the traffic mirroring sessions that have this EKS cluster as a mirror target. Thesniffer.vpcmirror.portsvalue refers to a list containing the port numbers where your applications are being served from.+ Another example
If we had three mirroring sessions with VNIs
861,862and92, to mirror traffic from three different sources in which ports8000,80and3000are exposed, it would result in the following yaml file:sniffer: enabled: true logger: rules: include debug vpcmirror: enabled: true vnis: - 861 - 862 - 92 ports: - 8000 - 80 - 3000
Upgrade your Resurface helm release with the following command
helm upgrade resurface resurfaceio/resurface -n resurface -f vpcm.yaml --reuse-values
- Go to the Resurface UI, make some calls to your API and see them flowing into your Resurface instance!